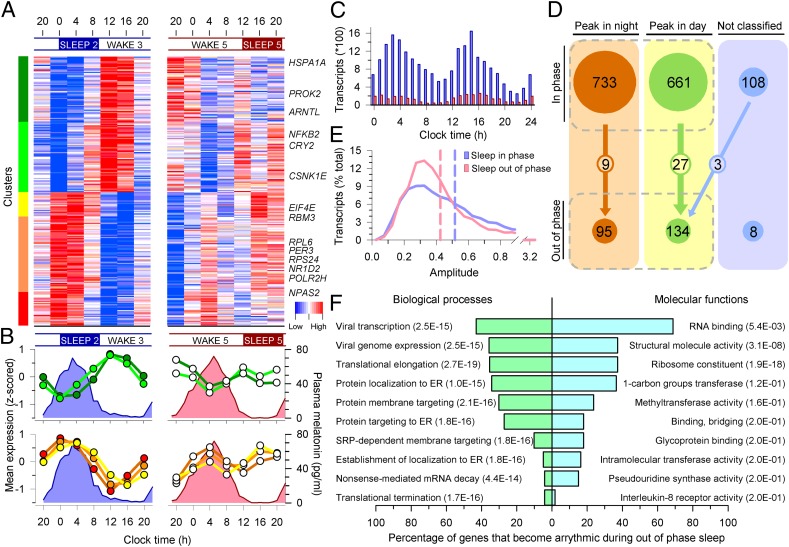
Fig. 2.
Mistimed sleep disrupts the circadian transcriptome. (A) Median expression profiles of circadian transcripts when sleeping in phase with melatonin (Left) and their profiles when sleeping out of phase (Right) (n = 19 paired participants). Colored bars on the left indicate clusters of day-peaking (B, Upper Left) and night-peaking (B, Lower Left) transcripts. Profiles of these transcripts were disrupted when sleep occurred out of phase with melatonin (A and B, Right). Average melatonin profiles are indicated by blue and pink area plots. (C) Peak expression phase distribution of prevalent circadian transcripts while sleeping in phase (blue bars; n = 16,253 derived from 1,502 circadian transcripts in an average of 10.84 subjects; minimum number of subjects for an FDR < 5%, 10) and out of phase (red bars; n = 2,503 derived from 237 circadian transcripts in an average of 10.56 subjects). (D) A total of 733 night and 661 day in-phase circadian transcripts reduced to 95 and 134 out-of-phase transcripts, with 9 and 27 common to both (n = 19 paired participants); 108 rhythmic transcripts were not classified as either day or night when sleeping in phase, and this category contained only eight transcripts during out of phase. (E) Out-of-phase prevalent circadian transcripts (red plot) had a lower mean amplitude (0.4264, red dashed line) than in-phase prevalent transcripts (blue plot; 0.5169, blue dashed line) (95% confidence interval, −0.1012 to −0.0797; P < 2.2 × 10⁻¹⁶). (F) Top 10 GO processes and functions associated with transcripts that became arrhythmic when sleeping out of phase.

