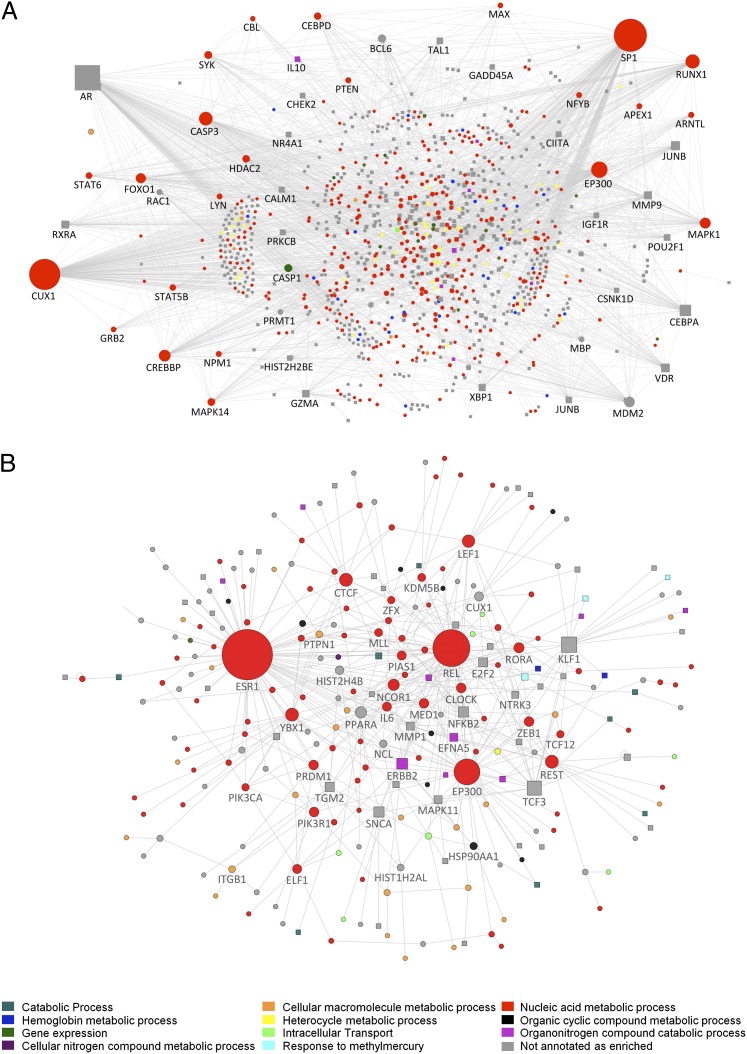
Fig. 5.
Direct interaction networks between genes for which at least one transcript had a statistically significant interaction between sleep condition and sample time (A) or a main effect of sleep condition (B). Up-regulated genes (on average) in the out-of-phase condition compared with in-phase are indicated as square nodes and down-regulated ones by circles. Node size reflects the number of direct connections a gene has within the network. Node color (see key) represents the most enriched association with a top 10 GO biological process. Downloadable, interactive versions of A and B are available at http://sleep-sysbio.fhms.surrey.ac.uk/PNAS_14/.

