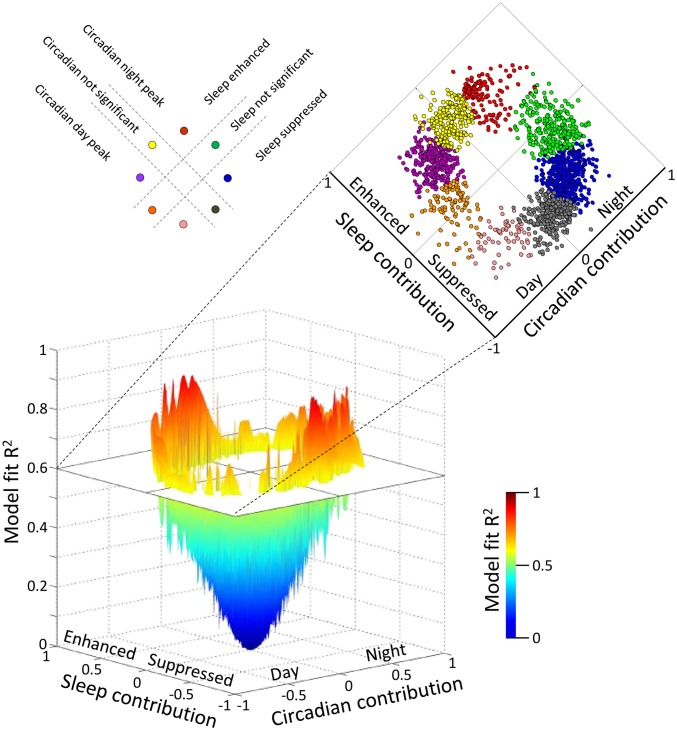
Fig. 6.
Modeling the contribution of circadian and sleep–wake drive on transcript expression profiles. A model that describes the temporal profile of transcripts as a linear combination of the 28-h sleep–wake cycle and 24-h circadian rhythmicity was fitted to the median expression profile of each transcript (median of z-scored data across 19 paired participants per sample time point). In the 3D plot, the horizontal plane maps the estimated coefficient of the contribution of the sleep–wake cycle against the contribution of the circadian rhythmicity, whereas the corresponding model fit R2 value is indicated by the vertical axis (n = 41,119 transcripts). Transcripts with a model fit R2 > 0.6 (1,792 transcripts) were further classified into eight distinct categories (indicated with different colors in the vertical plane) based on the contribution of the sleep–wake cycle and the contribution of the circadian rhythmicity as follows: transcripts with no significant sleep contribution, which were primarily determined by circadian rhythmicity with a peak at night (green) or day (orange); transcripts with a significant circadian contribution with a peak at night and an enhancing effect of sleep (red) or a suppressive effect of sleep (blue); transcripts with a significant circadian contribution with a peak during the day and an enhancing effect of sleep (purple) or a suppressive effect of sleep (pink); and transcripts with no significant circadian component, which were enhanced by sleep (yellow) or suppressed (gray).

