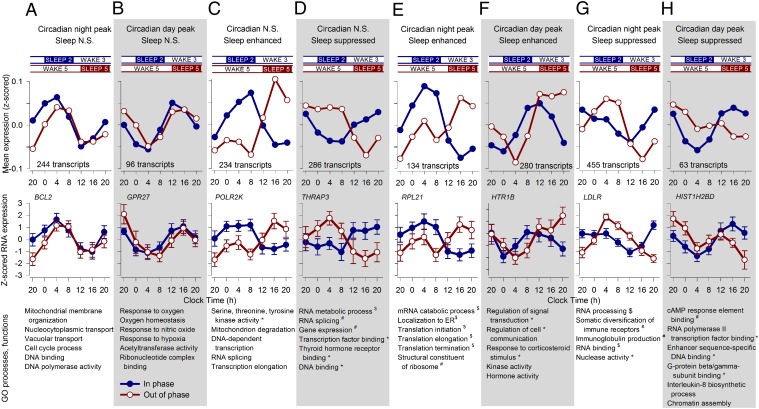
Fig. 7.
Estimating the separate contribution of circadian rhythmicity and sleep to the temporal organization of the transcriptome. A model describing the temporal profile of transcripts as a linear combination of the 28-h sleep–wake cycle and 24-h circadian rhythmicity was fitted to the median expression profiles (z-scored data across all participants per sample point) of all transcripts (Fig. 6). The model identified transcripts that were only driven by circadian rhythmicity with a positive drive during the night (A) or a positive drive during the day (B). Two groups of transcripts were only driven by sleep, which enhanced (C) or suppressed (D) the levels of these transcripts. Other transcripts were affected positively by sleep and also by circadian rhythmicity at night (E) or circadian rhythmicity during the day (F), whereas others were suppressed by sleep and had either a circadian night (G) or day peak (H). Also shown are the group time course, number of transcripts per category, example mean expression profile (log2 ± SEM) while sleeping in (blue line) and out of phase (red line), together with top 10 GO processes and functions associated with the set of transcripts (*P < 0.05; #P < 0.01; $P < 0.001).

