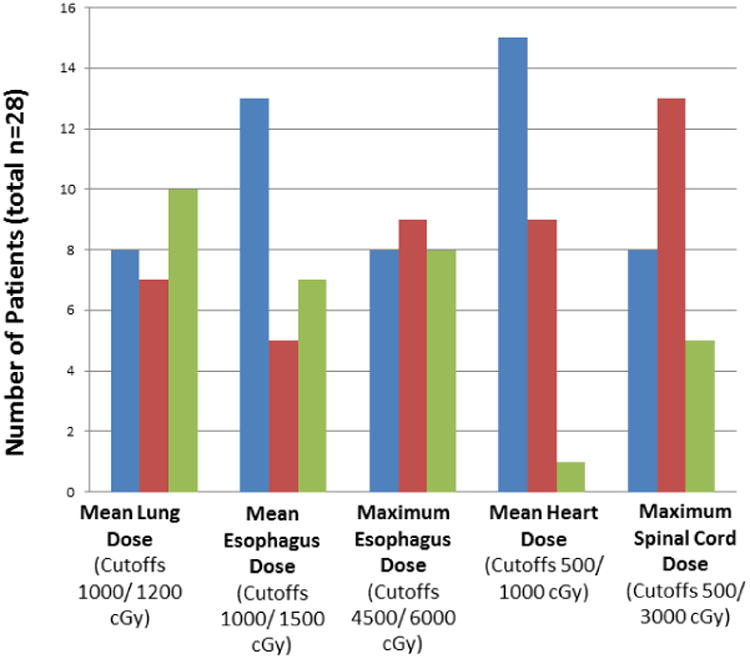
Figure 2.

Distribution of radiation doses to normal structures. Blue bars represent the numbers of patients with doses less than the first cutoff value; red bars, patients with doses between the first and second cutoff values; and the green bars, patients with doses above the second cutoff value. The cutoff values were chosen based on the distribution of doses actually received rather than the dose constraints (see Table 1).
