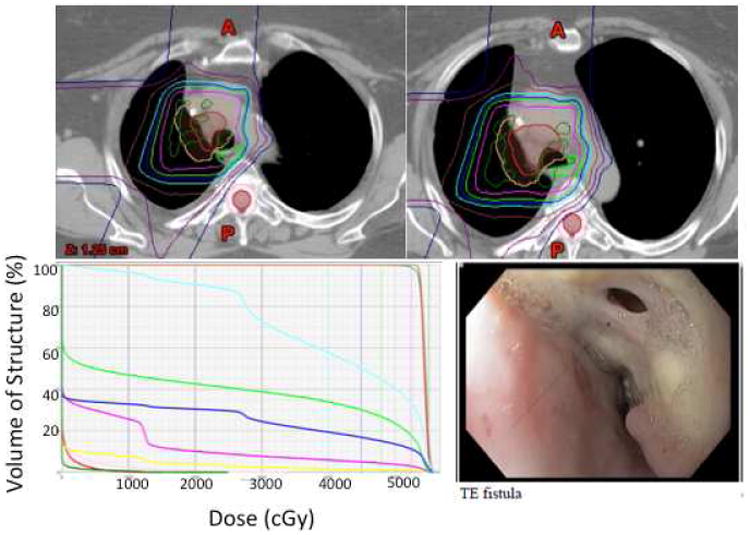
Figure 3.

Top, isodose distribution on axial CT slices in the patient who developed a transesophageal fistula. Pink, 52.5 Gy(RBE), dark blue, 45 Gy(RBE), aqua, 40 Gy(RBE), brown, 30 Gy(RBE). Bottom left, dose-volume histogram of normal tissue structures for the same patient. Green, esophagus, dark blue, total lung, pink, heart, aqua, right lung, red, spinal cord. Bottom right, endoscopic image of transesophageal fistula, which had been stented before the patient experienced massive hemoptysis.
