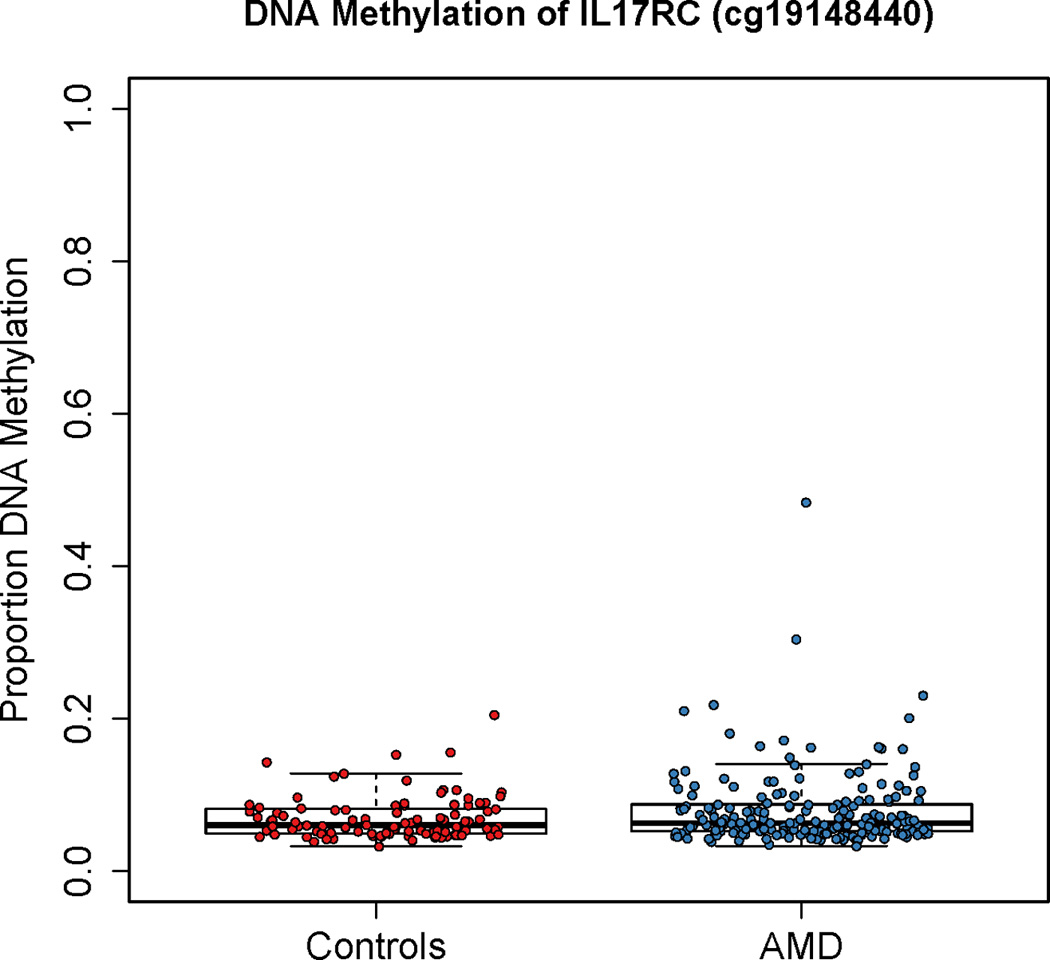
Figure 1.

Methylation of the IL17RC promoter in peripheral blood from the Michigan AMD-MMAP cohort as measured by the Illumina 450K Bead Array at probe cg19148440. This region corresponds to the previously reported differentially methylated region in AMD (Wei et al., 2012). The proportion of DNA methylation from control (red, N = 99) and AMD (blue, N = 199) is plotted for each individual. There was no statistically significant difference in methylation between the AMD and control groups. See also Figure S1, Table S1.
