
Figure 3.
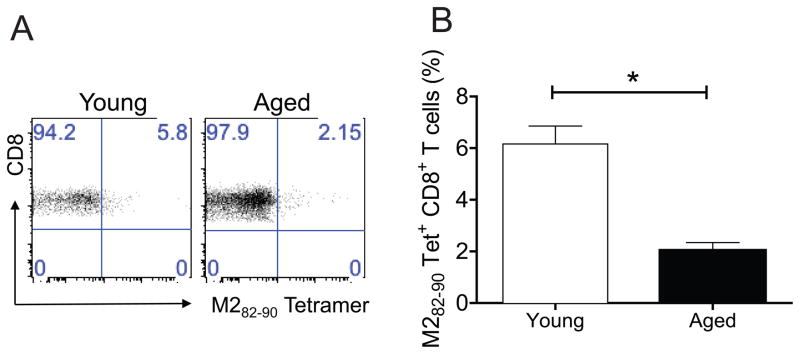
Comparison of M282–90 epitope-specific CD8+ T cells in young and aged mice after TriVax vaccination. Young BALB/c mice (n=5) and aged BALB/c mice (n=5) were used. Groups of mice were vaccinated once with TriVax via i.v route. PBLs were isolated at day 6 post prime. (A) Representative dot plots are shown where the numbers in upper right quadrant gate represent the % of CD3+CD8+ cells that were tetramer positive. (B) The % tetramer positive CD3+CD8+ T cells in PBLs ± SEM (right) (* = P < 0.05, t-test). Data shown represent one of three experiments with similar results.