
Figure 5.
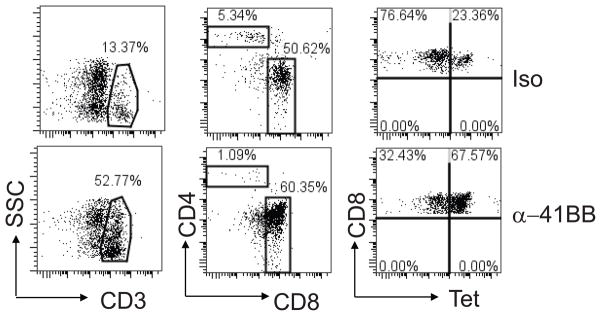
Enumeration of CD3+, CD3+CD4+, CD3+CD8+ , Tet+CD8+ T lymphocytes in blood. Groups of aged BALB/c mice (n=5) were vaccinated with TriVax + isotype control (iso, upper plots) or TriVax + α-41BB mAb (α-41BB, bottom plots) as illustrated in Fig. 4. PBLs were isolated at day 20. Polygon gates showed the % CD3+ T cells in blood. % CD3+CD4+ or % CD3+CD8+ T cells was shown in a rectangular gate in the middle plot. Upper right quadrant gates represented the % of CD3+CD8+ T cells that were M282–90 tetramer positive. Dot plots presented in Fig. 5 are representative of the percentage of CD3+, CD3+CD4+, CD3+CD8+, and CD8+Tet+ T cells.