
Fig. 1.
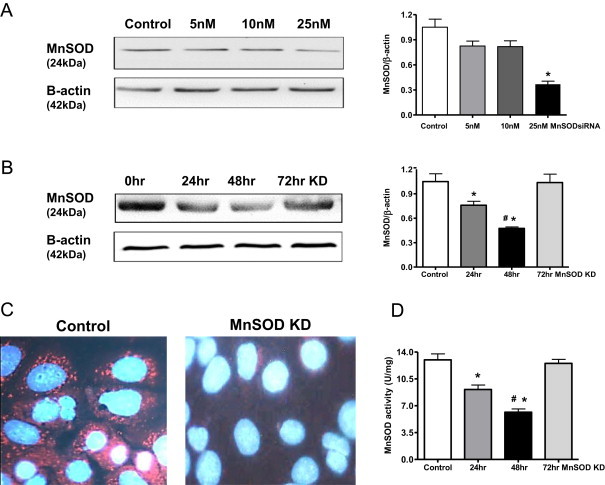
Transient MnSOD knockdown in NRK cells. (A). MnSOD western blot after transfection (48 h) with 0–25 nM MnSOD siRNA. β-Actin was used as a loading control. (B) MnSOD western blot showing time course after transfection with 25 nM MnSOD siRNA. Graphs represent values after densitometric quantification of western blot results. (C) Representative MnSOD immunocytochemistry image showing decreased MnSOD expression after knockdown (KD) (25 nM siRNA; 48 h). Red stains for MnSOD, and blue DAPI stains for nuclei. (D) MnSOD activity decreased at 24 h following MnSOD KD, further decreased at 48 h and recovered to control level at 72 h. Control cells were treated with 25 nM nonsense siRNA. All data shown are mean±SEM (n=7). *p<0.05 compared to control cells; #p<0.05 compared to 24hr treated cells.