
Figure 3.
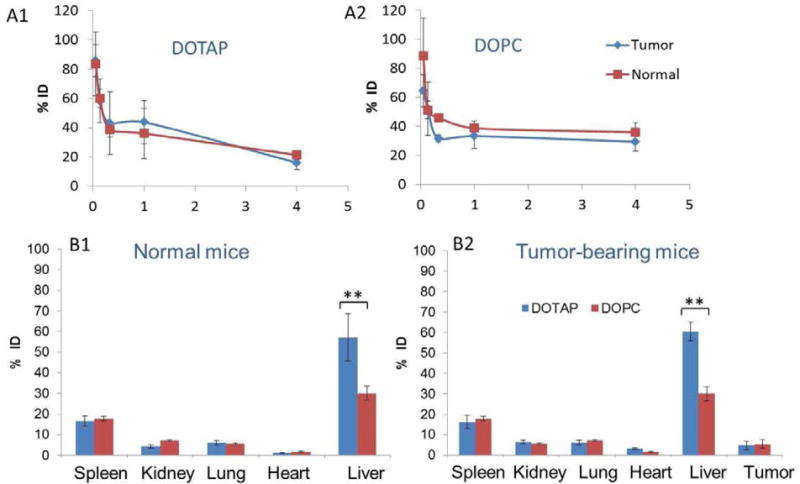
Pharmacokinetics of LCP- DOTAP NPs (A1) and LCP- DOPC NPs (A2) with 20% PEGylation. Biodistribution of LCP-DOPC NPs and LCP-DOTAP NPs with 20% PEGylation in normal (B1) and tumor-bearing mice (B2). Data are shown as % injected dose (ID). Statistical analysis was carried out using a two tailed t-test. ** P < 0.05 for liver accumulation of LCP- DOTAP NPs group compared to LCP- DOPC NPs group in both normal and tumor-bearing mice.