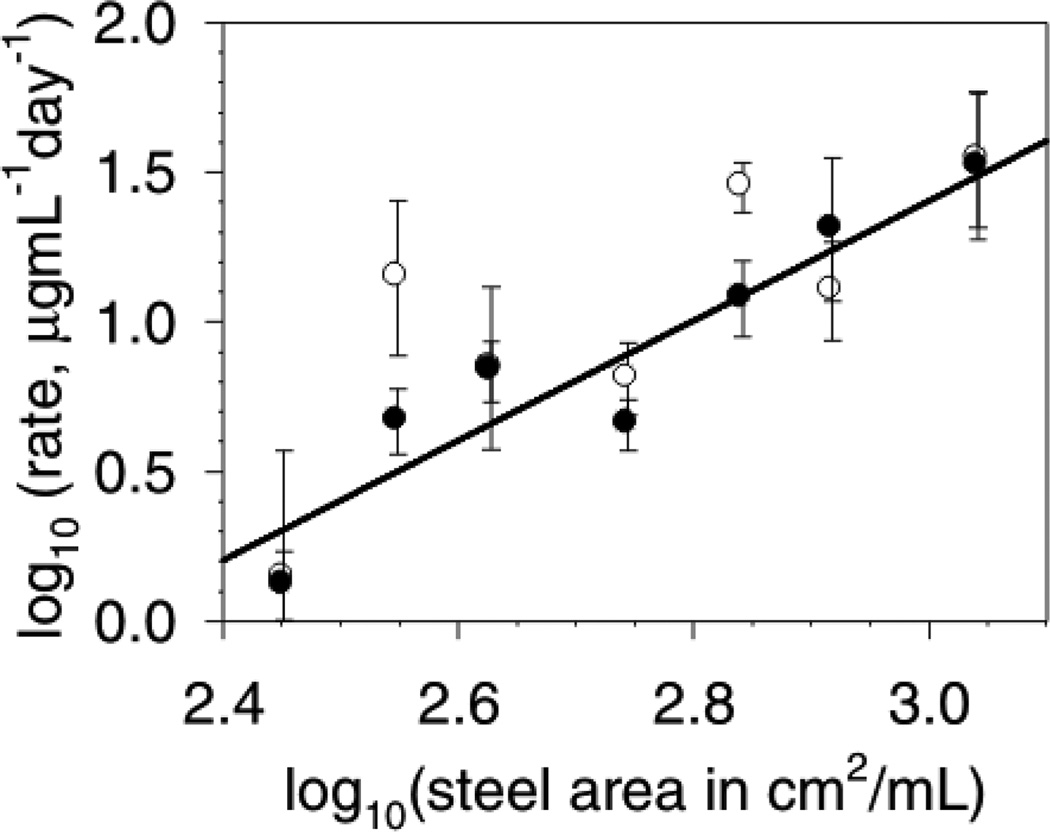
Figure 2.
Initial rate of aggregation as a function of steel surface area. The mAb was at 1.0 mg/mL. Data is presented as a log10-log10 plot. Data is the average aggregation rate and the error bars represent the 95% confidence interval of the aggregation rates. Rate data from: soluble aggregates appearance (●); decrease in monomer levels (○). The line represents the regression fit to the increase in soluble aggregates data with the slope fixed at 2.0 ± 0.3 (r2 = 0.88), with intercept of −4.6 ± 0.9 (quoted errors are standard errors of the fit). Allowing the slope to float results in a slope of 2.1 ± 0.3 (r2 = 0.88) and so is not significantly different than a slope of 2.0. The fit to the monomer loss data gives a slope of 1.7 ± 0.6, and intercept of −4 ± 2with r2 = 0.6.

