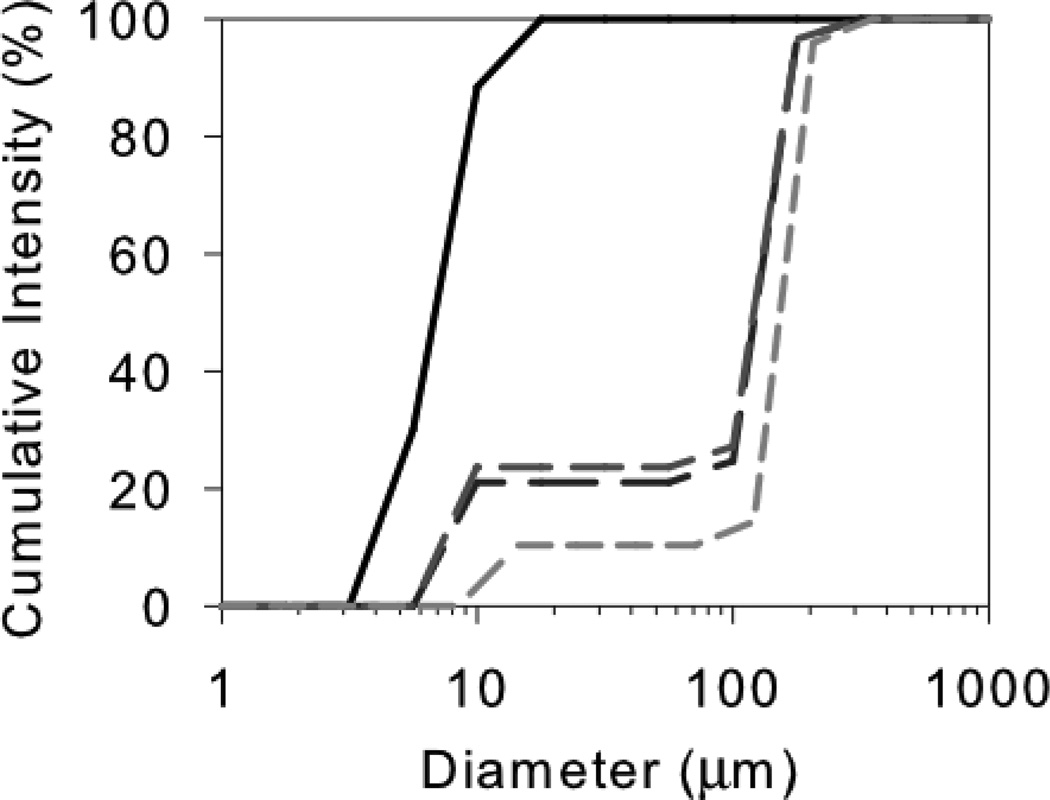
Figure 5.
Cumulative size distributions of mAb after exposure to steel. Cumulative intensities: control mAb, solid black line; after 30 min, long-dash line; after 20 hours; medium-dash line; after 4 days, short-dash light gray line. Each distribution is a single result representative of triplicate samples. The monomer is about 10 nm and the soluble aggregates about 200 nm in diameter.

