Figure 3.

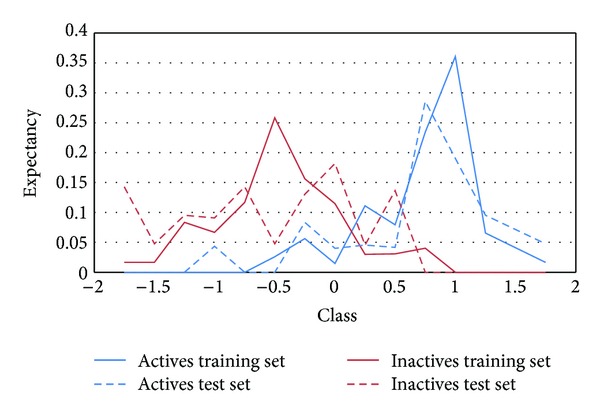
PDD showing the distribution of training and test set active and inactive compounds along the score values of the model. An acceptable superposition between both sets can be observed.

PDD showing the distribution of training and test set active and inactive compounds along the score values of the model. An acceptable superposition between both sets can be observed.