Figure 1.

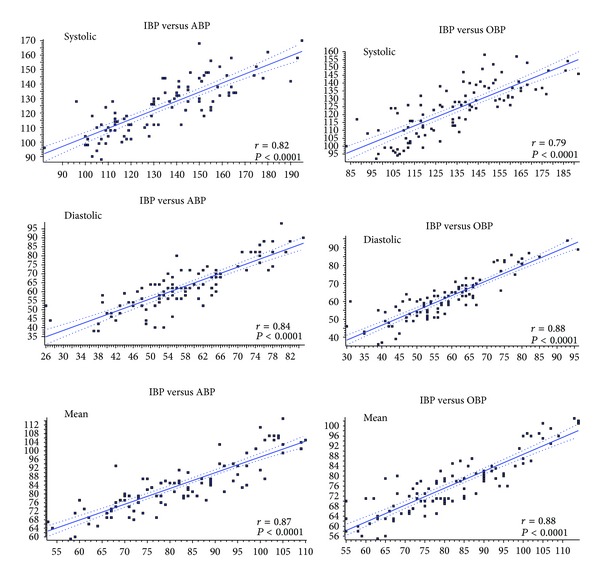
Scatterplot and correlation between systolic, diastolic, and mean blood pressure in comparisons between direct-invasive (IBP) and, respectively, auscultatory-aneroid (ABP) and oscillometric automated (OBP) methods.

Scatterplot and correlation between systolic, diastolic, and mean blood pressure in comparisons between direct-invasive (IBP) and, respectively, auscultatory-aneroid (ABP) and oscillometric automated (OBP) methods.