
Figure 2.
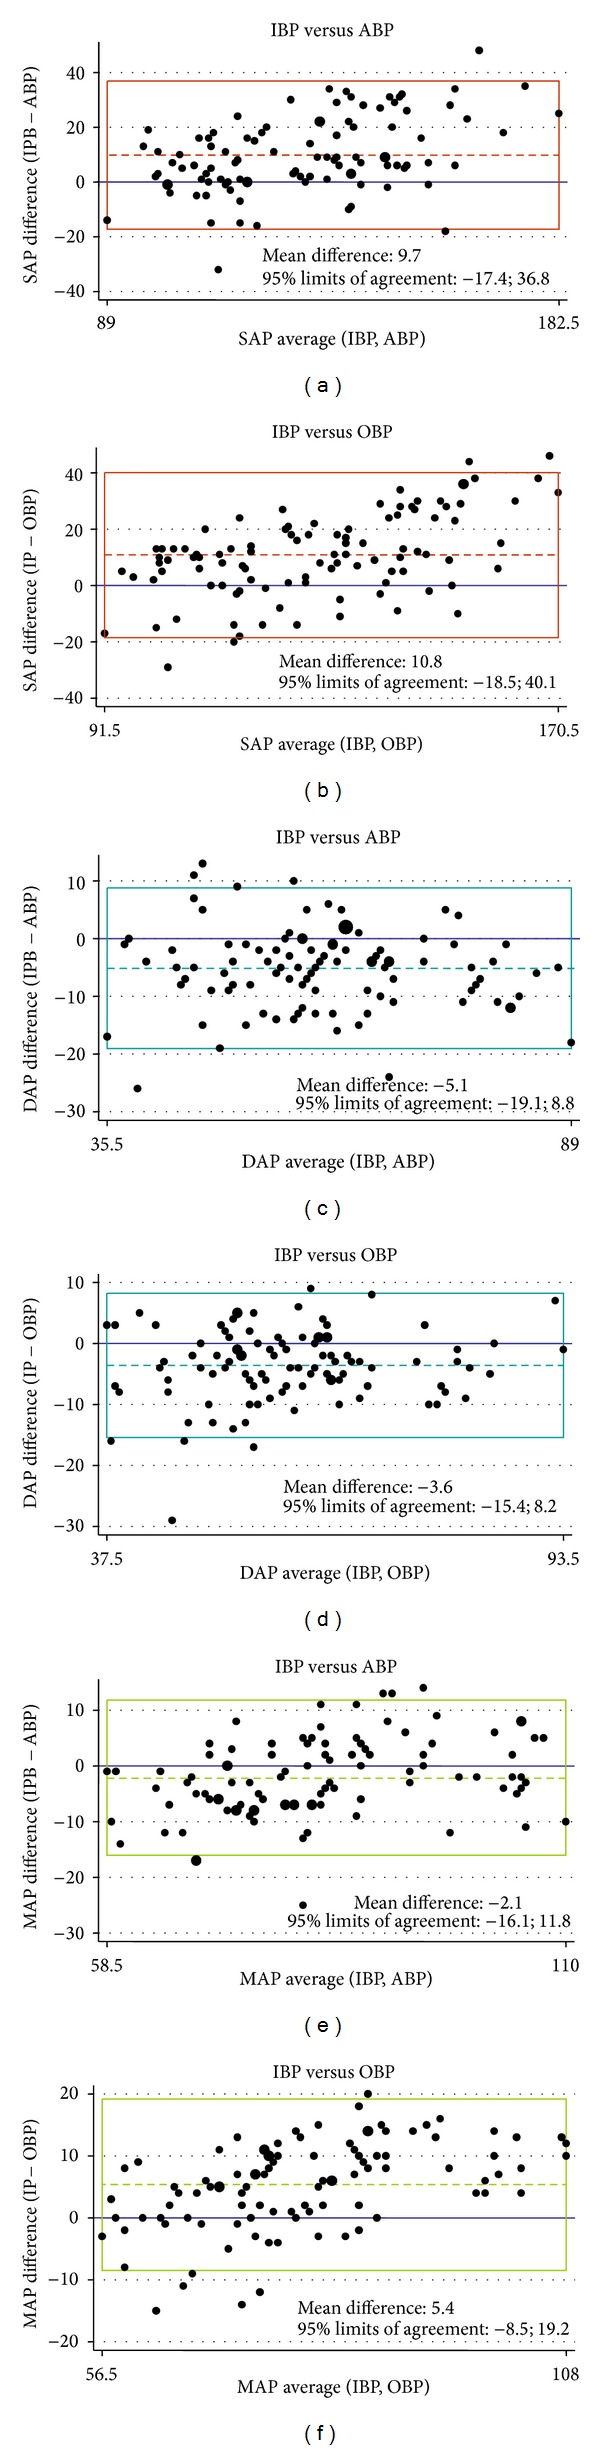
Bland-Altman analysis of the agreement between systolic (SAP), diastolic (DAP), and mean (MAP) arterial pressure in comparisons between direct-invasive (IBP) and, respectively, auscultatory-aneroid (ABP) and oscillometric automated (OBP) methods. The dashed line represents the mean bias; the upper and lower limits of the box represent the 1.96 ± SD limits of agreement.