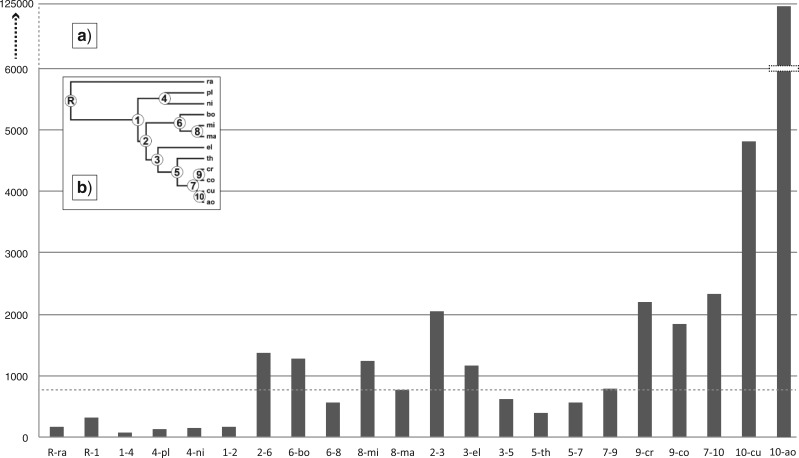
Figure 5.
(a) Summary of median diffusion rates between adjacent node pairs in the MCC species-tree, here presented on the y-axis as diffusion distance per time unit (km/Ma). Dotted line indicates median rate across all branches in the species-tree. (b) Outline of species-tree. Taxon abbreviations and node numbers follow those in Figure 6b.

