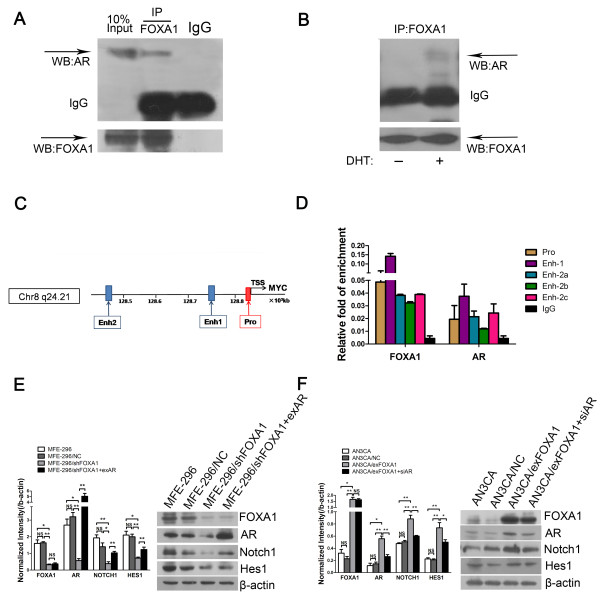
Figure 4.
FOXA1 affects AR-mediated transcription via binding with AR and activates the Notch pathway. A: Co-immunoprecipitation (IP) of FOXA1 with AR in MFE-296 cells. WB: western blotting. B: Co-immunoprecipitation of FOXA1 with AR in AN3CA cells treated with 10−7 M DHT or vehicle. C: Schematic representation of the MYC locus. FOXA1-binding sites and AR-binding sites upstream of the TSS of MYC were predicted by ChIP-seq analysis. ChIP-PCR assays were performed using anti-FOXA1 antibody or anti-AR antibody. Pro: promoter region; Enh-1: enhancer 1 region; End-2: enhancer 2 region; TSS: transcription starting sites. D: Immunoprecipitated DNA fragments in ChIP-PCR assays were examined by qRT-PCR. Each sample was assayed in triplicate in each of three independent experiments. IgG was used as negative control. Primers were designed specifically for the promoter region (Pro), the enhancer 1 region (Enh-1), and the three putative FOXA1-AR binding sites within enhancer 2 region (Enh-2a, Enh-2b, and Enh-2c) according to the study [19]. E: Protein levels of FOXA1, AR, Notch1, and Hes1 in untransfected MFE-296 cells (MFE-296) and MFE-296 cells transfected with NC (MFE-296/NC), shFOXA1 (MFE-296/shFOXA1), or shFOXA1 and exAR (MFE-296/shFOXA1 + exAR) were measured by western blotting (Right), and further quantified by densitometry of triplicate experiments (Left). F: Protein levels of FOXA1, AR, Notch1, and Hes1 in untransfected AN3CA cells (AN3CA) and AN3CA cells transfected with NC (AN3CA/NC) , exFOXA1 (AN3CA/exFOXA1), or exFOXA1 and siAR (AN3CA/exFOXA1 + siAR) were measured by western blotting (Right), and further quantified by densitometry of triplicate experiments (Left). β-actin was used as a loading control. *p < 0.05, **p < 0.01 and NS p > 0.05.

