Figure 6.
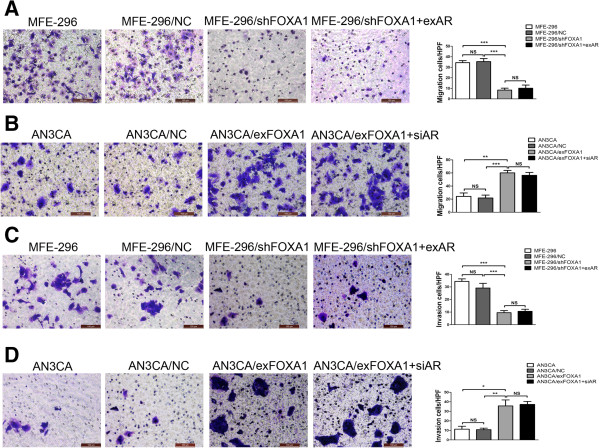
FOXA1 induces migration and invasion in EC cells. A: Cell migration of MFE-296, MFE-296/NC, MFE-296/shFOXA1 and MFE-296/shFOXA1 + exAR cells was assessed by the transwell migration analysis (Left). The mean ± SD number of migrated cells of three independent experiments was showed in the right panel. The abbreviation “HPF” on the y axis means one high power field. B: Cell migration of AN3CA, AN3CA/NC, AN3CA/exFOXA1 and AN3CA/exFOXA1 + siAR cells were subjected to transwell migration analysis (Left). The mean ± SD number of migrated cells of three independent experiments was showed in the right panel. C: Cell invasion of MFE-296, MFE-296/NC, MFE-296/shFOXA1 and MFE-296/shFOXA1 + exAR cells was assessed by the transwell invasion analysis (Left). The mean ± SD number of invased cells of three independent experiments was shown in the right panel. D: Cell invasion of AN3CA, AN3CA/NC, AN3CA/exFOXA1 and AN3CA/exFOXA1 + siAR cells by three independent experiments were subjected to transwell invasion analysis (Left). The mean ± SD number of invased cells of three independent experiments was showed in the right panel. (Magnification, 200×). *p < 0.05, **p < 0.01, ***p < 0.001, and NS p > 0.05.

