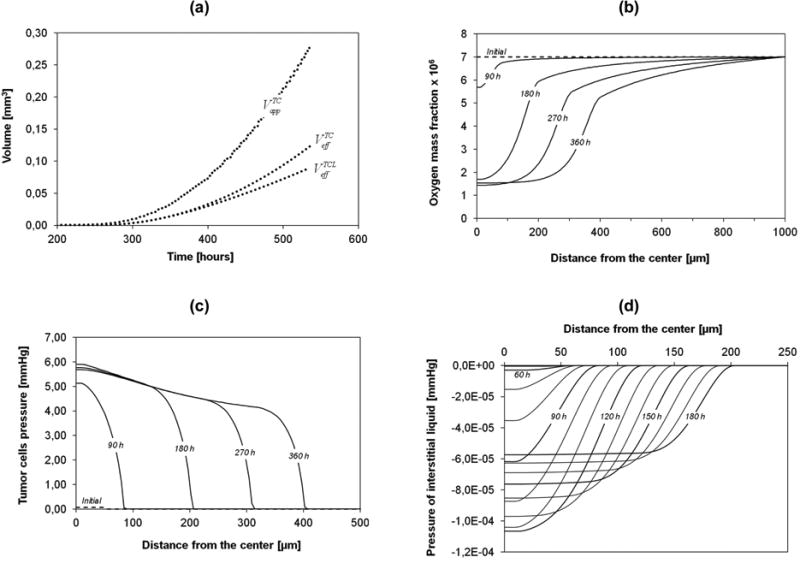
Figure 5.

(a) Apparent volume of the tumor spheroid, effective volume of the tumor cells, and the effective volume of the living tumor cells, over time. (b) Mass fraction of oxygen over 360h. (c) Pressure in the tumor cells phase over 360h. (d) Numerical prediction of the interstitial fluid pressure over 180h; Lines drawn at every 10h of simulations.
