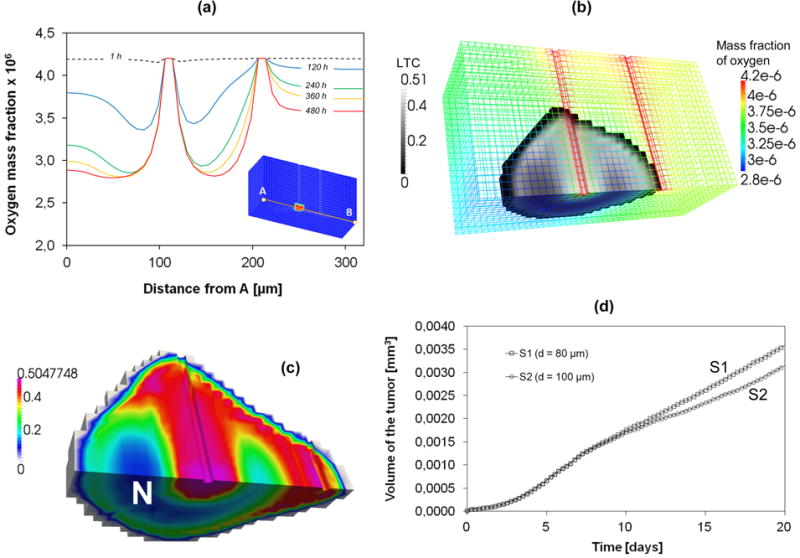
Figure 9.

(a) Mass fraction of oxygen along the line joining points A and B for S2. (b) Volume fractions of the LTC and oxygen mass fraction for S2 at 15 days. (c) Volume fractions of the LTC for S2 at 20 days. “N” indicates the necrotic areas. (d) Volume of the tissue invaded by the tumor.
