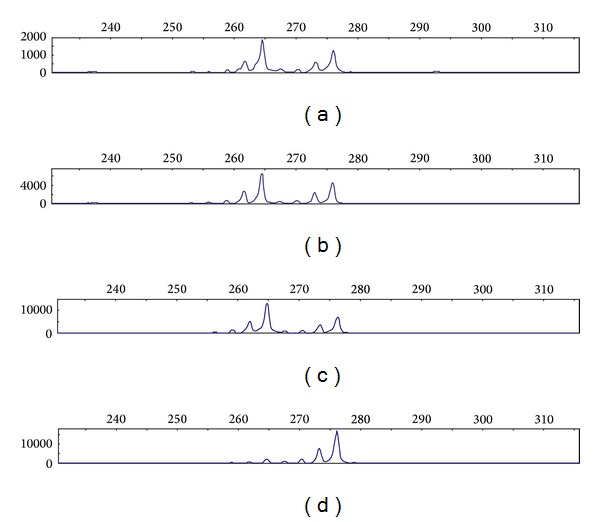
Figure 2.

HUMARA analysis. The panels show size-separation of PCR products by capillary electrophoresis. The x-axes show the sizes in base pairs and the y-axes the fluorescence activity. Each peak corresponds to one allele of the amplified microsatellite. Controls (a) and (b): random methylation pattern: no difference observed between the undigested sample (a) and digested sample (b). Patients (c) and (d). (c) Genomic DNA: two alleles are visible at 264 and 276 base pairs. Semiquantitative PCR showed that the 264-base pair allele was located on the idic(X)(q13), visible as a peak height ratio of 1.86. (d) After digestion, only the 276-base pair peak was present, showing that the isodicentric chromosome was active.
