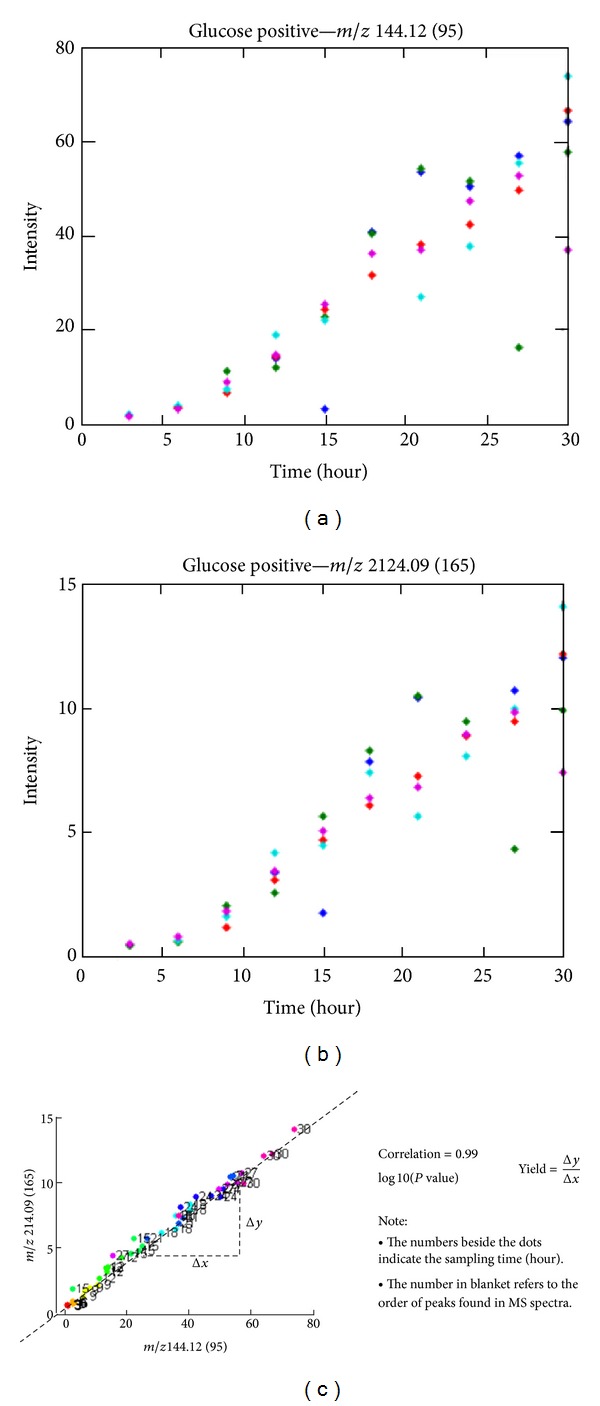
Figure 2.

The cherry-picking process illustrated. Two upper figures show two selected metabolites during the first step, and the lower figure shows their corresponding correlation in time. Both metabolites will be picked. Slopes (yields) in the matrix that had a P value less than 0.01 were set to zero.
