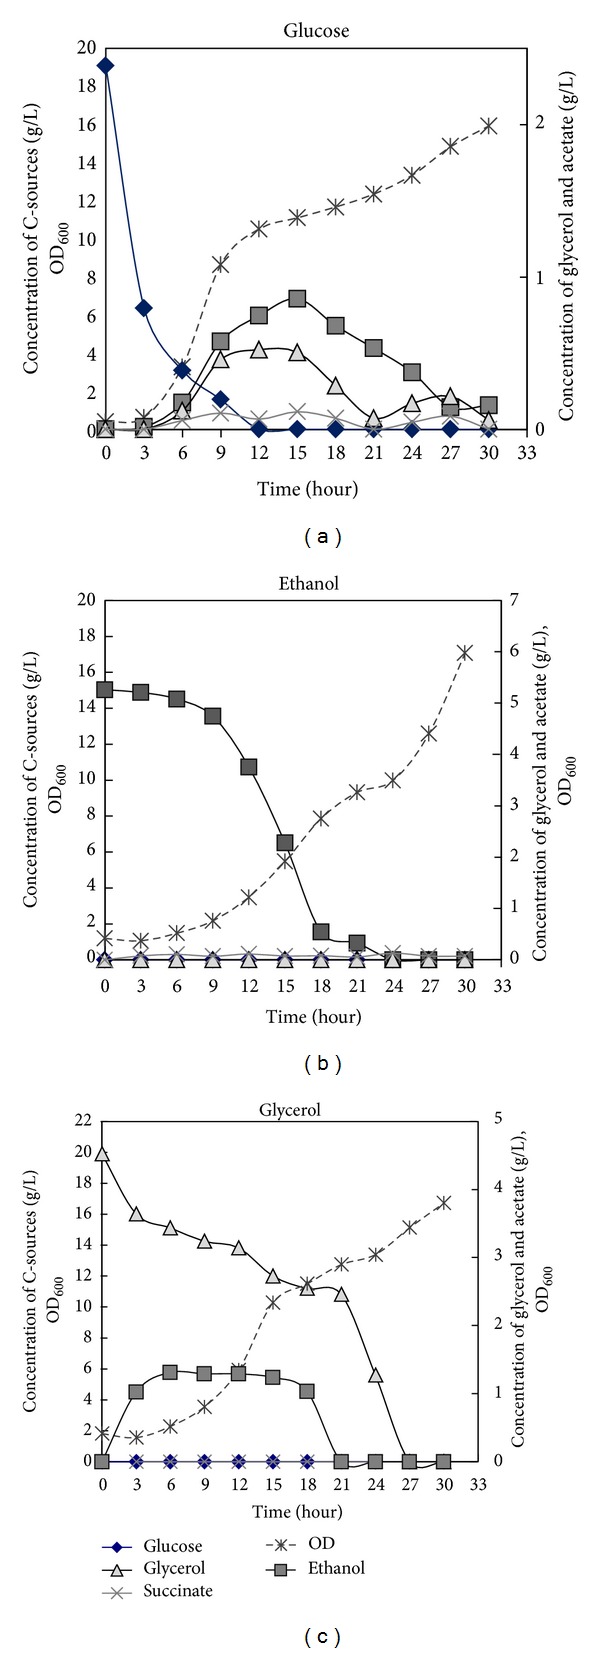
Figure 3.

Profiles of growth (OD600) and metabolite concentrations; glucose, glycerol, succinate, and ethanol of yeast BY4709 during the fermentationmeasured by HPLC. The plots show fermentation profile grown in different carbon sources; glucose (a), ethanol (b), and glycerol (c).
