Figure 5.

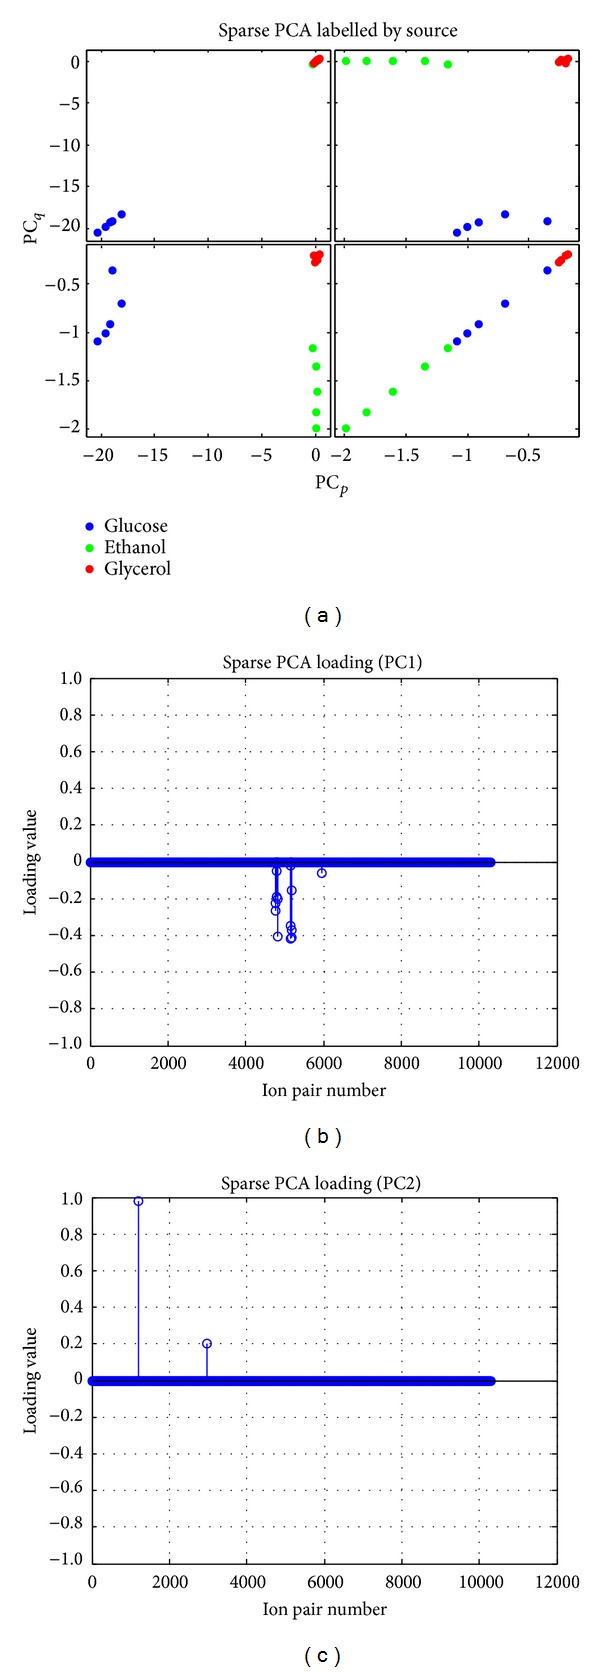
Sparse PCA and loading show the clustering of different C-source (including both ESI modes) and 5 replicates based on yield/slope of metabolite profile.

Sparse PCA and loading show the clustering of different C-source (including both ESI modes) and 5 replicates based on yield/slope of metabolite profile.