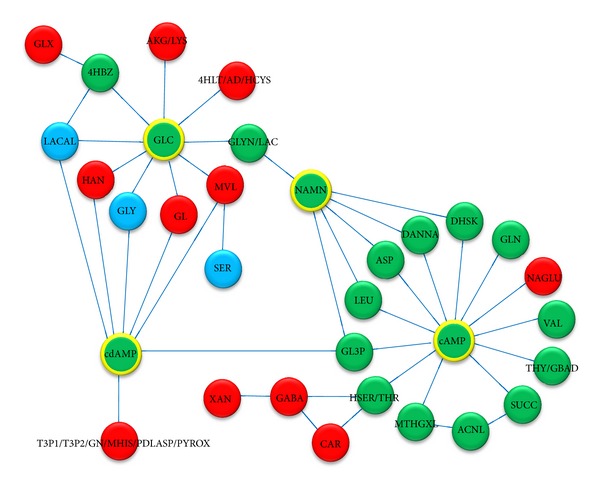
Figure 6.

Key metabolite network on PC1; there are 32 key metabolites linking to each other with 4 hubs, that is, glucose, cyclic AMP, cyclic dAMP, and NAMN in PC1 network. These key metabolites can be used as PC1 to separate the sample taken from glucose culture from ethanol and glycerol cultures. Since there are 3 different patterns of changing in metabolite profile, these nodes are shown in 3 different colors; red (increasing), (decreasing), and blue (nonmonotonous or constant).
