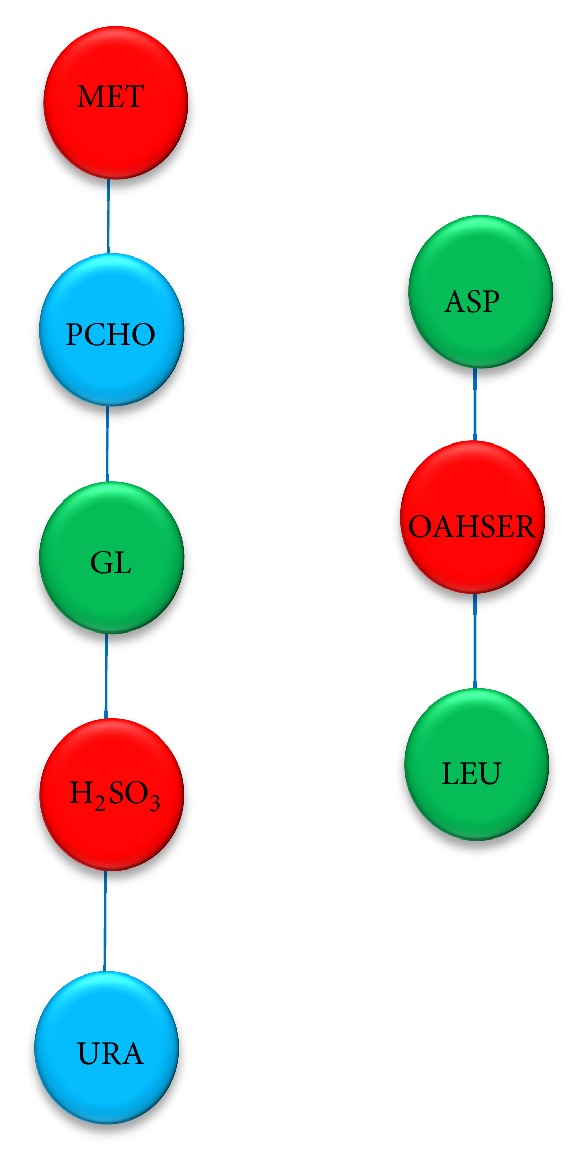
Figure 7.

Key metabolites network on PC2; there are 8 key metabolites in PC2 network, 5 and 3 nodes in each subnetwork. These key metabolites can be used as PC2 to separate the sample group taken from ethanol culture from glycerol culture. Since there are 3 different patterns of changing in metabolite profile, these nodes are shown in 3 different colors; red (increasing), (decreasing), and blue (nonmonotonous or constant).
