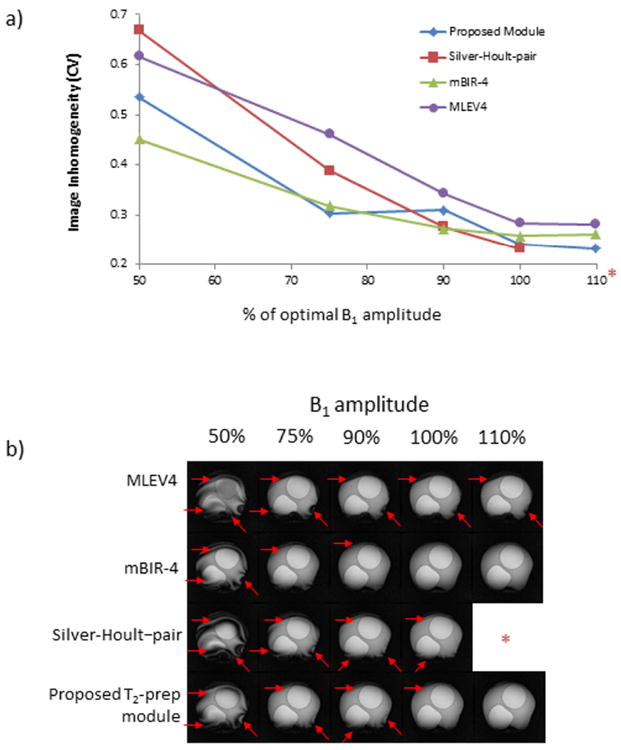
Figure 4. B1 Sensitivity.

a) B1 amplitude was varied between 50% to 110% of the calibrated value for the tested modules (*Note that B1 amplitude at 110% could not be tested for the Silver-Hoult–pair module because peak amplitude exceeded scanner capability). T2-prep time was 60 ms for all modules, and the coefficient of variation (CV) is shown as a function of transmitter voltage. b) Typical images are shown. Red arrows identify regional inhomogeneities. The mBIR-4 and the proposed T2-prep module provided a larger range of insensitivity to B1 than the MLEV4 and Silver-Hoult–pair modules.
