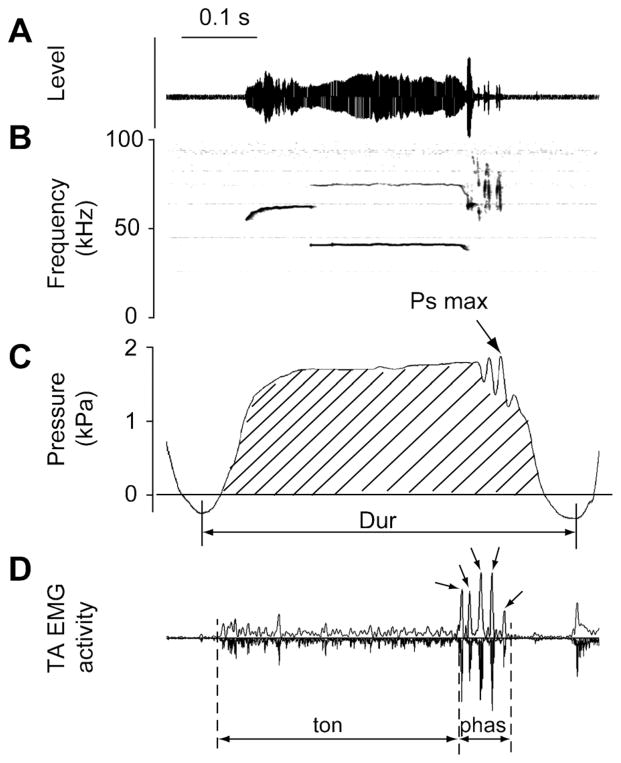
Figure 1.
Ten variables were measured in the EMG signal and the subglottal pressure signal Oscillogram (A), spectrogram (B), subglottal pressure signal (C) and TA muscle EMG signal (D) of a 50-kHz composite call. EMG activity is displayed as a rectified original trace (downward) and a low-pass filtered (300 Hz) trace (upward). Variables include the duration of the expiratory phase (“Dur”), the average subglottal pressure (RMS; lined area), maximum subglottal pressure (Ps max), the duration of the phasic increased EMG activity (“phas”) and the duration of the tonic increased EMG activity (“ton”). Other parameters are listed in Table 1. The small arrows in the EMG signal indicate individual bursts during the phasic activity. The number of bursts was counted.

