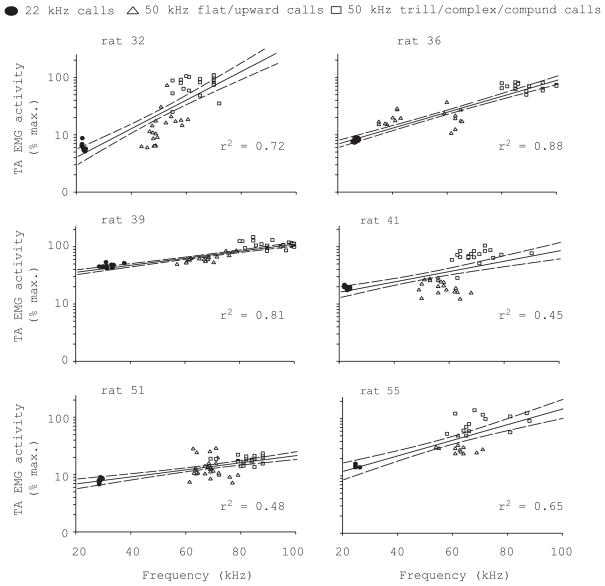
Figure 8.
There is a positive relation between TA muscle EMG activity (logarithmic scale on vertical axis) and fundamental frequency across different call types marked with different symbols. The filtered, full-wave rectified, integrated EMG voltage signal was averaged over the entire call and normalized to the maximum activity during swallowing. Best fit exponential correlation (solid line) and 95% confidence intervals (dashed lines) are shown.

