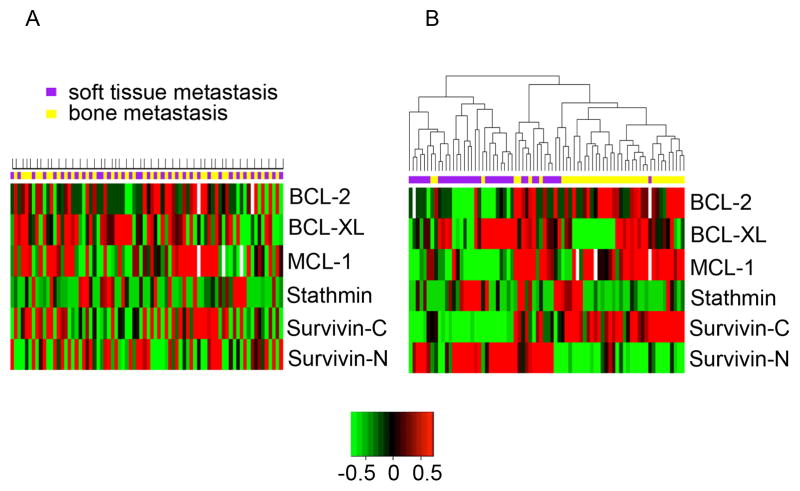
Figure 2. Cluster analysis of prostate cancer metastasis by protein expression.
The average expression of each marker was calculated separately across bone and soft tissue metastases from 44 patients. A) Supervised cluster analysis of patient metastases. For each patient bone and soft tissue metastases are aligned in consecutive columns. Above each column, bone metastases are indicated in yellow and soft tissue metastases in purple. In addition, patients are indicated by marks at the top. Please note that some patients have only bone or only soft tissue metastases. B) Unsupervised cluster analysis of patient metastases. Bone metastases are marked in yellow, while soft tissue metastases are marked in purple. Note segregation of groups according to metastatic sites in the unsupervised, but not the supervised cluster analysis. White color identifies cores that did not yield data.

