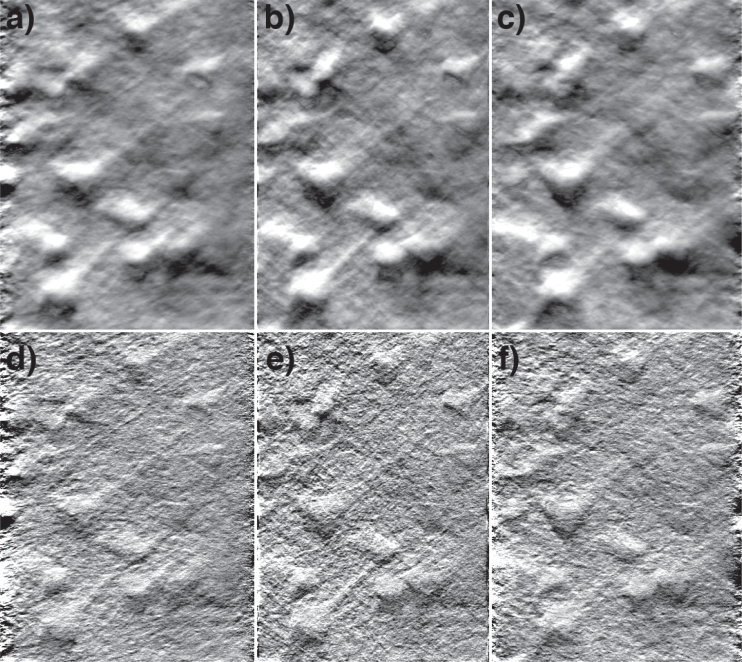
Fig. 5.
Integrated intensity projections from a phase-gradient z-stack of pyramidal neurons in a mouse brain slice (same sample as in Fig. 2). Panel b is a projection along the z-direction. Panels a,c are projections from ± 10° tilt directions (animation in Media 4 (1.7MB, AVI) ). Panels d–f are the same as the top row, but deblurred according to Eqn. (18) (animation in Media 5 (4.2MB, AVI) ). The projections are generated from a 67×96×42 μm3 volume.

