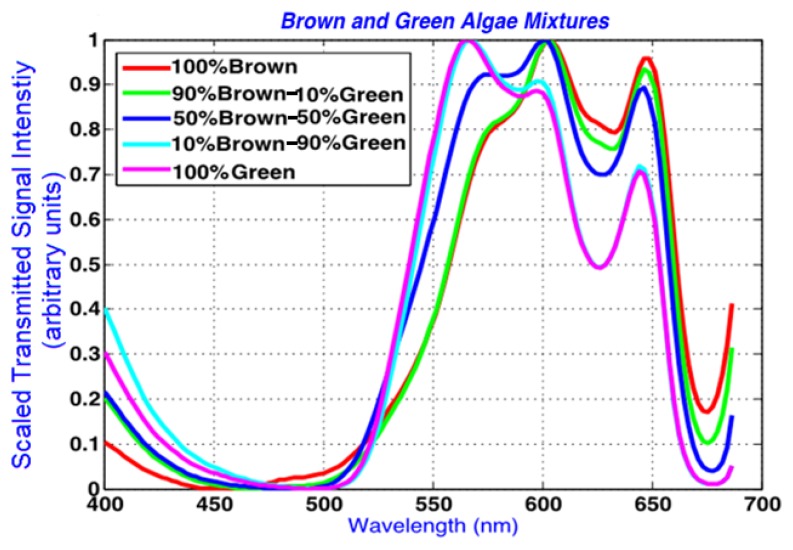
Figure 6.
Scaled spectra from 100% green, 100% brown (diatom: Cyclotella sp.), and various volumetric combinations of the two. The data is scaled between 0 and 1 within 400 and 690 nm as described in Section 2.3, and demonstrates the absorption bands and peak and shoulder shifts among the algae samples more clearly.

