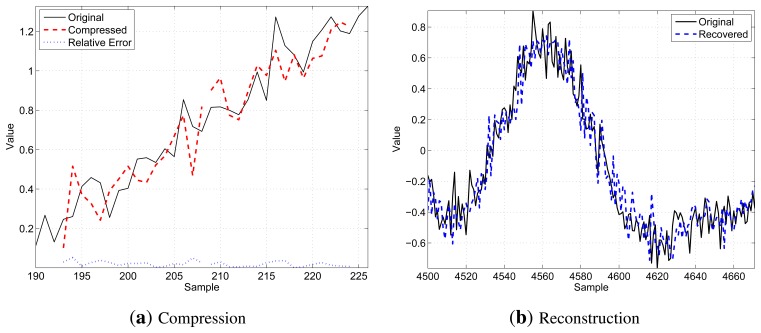
Figure 3.
A qualitative example of the transmission procedure for N = 16, K = 8 and b = 8: (a) shows two consecutive segments (thin black solid line) of N samples, as well as the related compressed values (bold red dashed lines) and the relative compression error (thin blue dotted lines in the bottom part of the chart); (b) shows the result of the decompression operation comparing a longer segment of the original signal (thin black solid line) with the received data after the decompression (bold blue dashed line).

