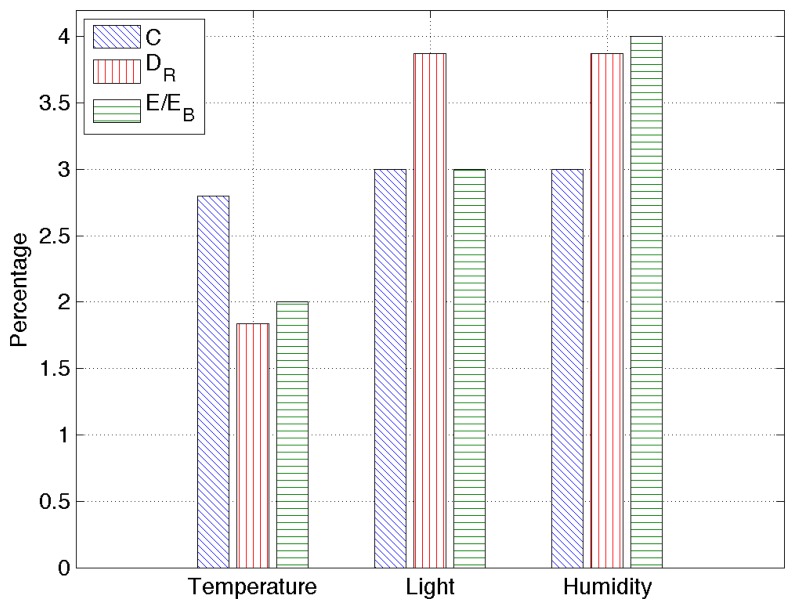
Figure 8.
RAZOR's performance overview in a real scenario for different sensors: temperature, humidity and light. The performance figures are the compression rate percentage, C, the relative root mean square error, DR, and the percentage of energy used with respect to the energy needed to send uncompressed data, E/EB.

