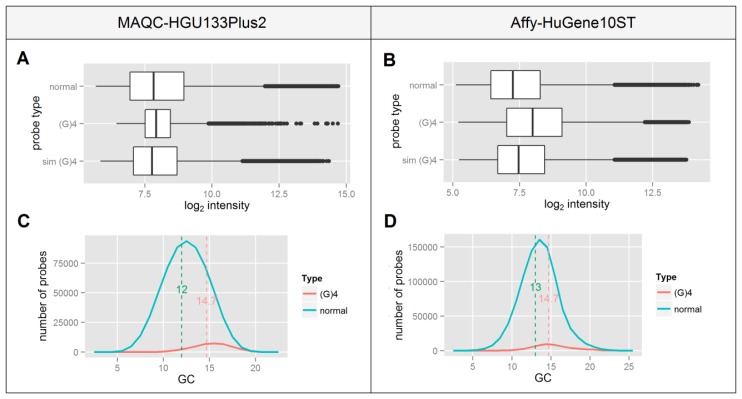
Figure 3.
Statistics of probes that contain (G)4 motif for both MAQC and Affy datasets (A,B) signal intensity boxplots of normal probes, probes that contain a (G)4 motif and a subset of “normal” probes that have the same GC content distribution as the (G)4 probes—“sim (G)4” (C,D) GC content distribution of normal and (G)4 probes with medians of both distributions marked with a dashed line.

