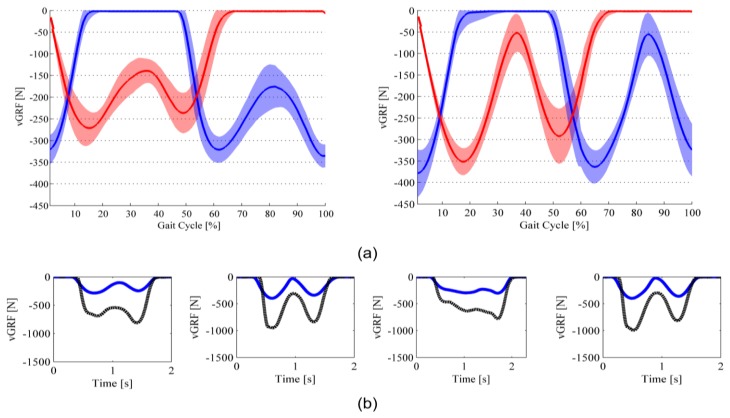
Figure 9.
νGRF profiles of Subject #2. Red line is the left foot; blue line is the right foot. (a) Average curve during slow- (on the left panel) and normal- (on the right panel) speed ground-level walking; (b) Comparison between the νGRF profile measured through the sensorized insole (solid blue line) and the force platform (dotted black line) in four different steps.

