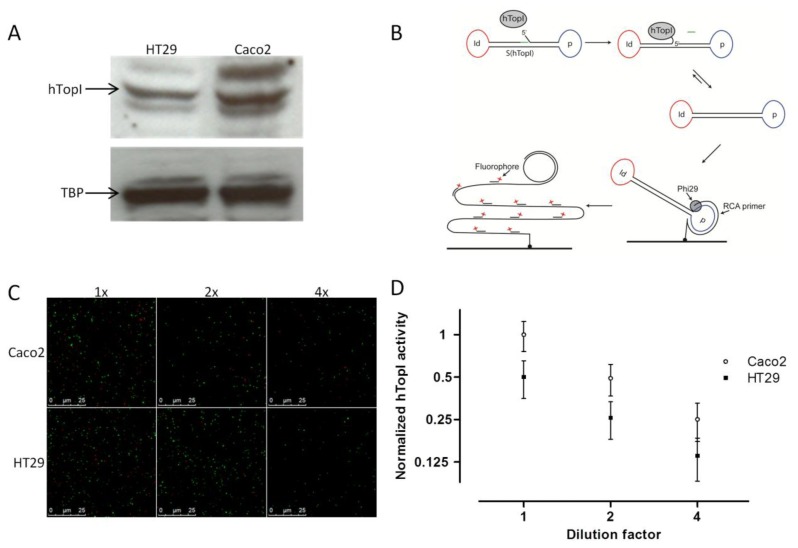
Figure 1.
(A) Western blot comparing the amount of hTopI protein in HT29 and Caco2. TATA binding protein (TBP) was used as loading control. (B) Graphic depiction of the REEAD assay. S(hTopI) is designed to adopt a dumbbell structure consisting of a stretch of double-stranded DNA connected by two loops holding a sequence identifying the substrate (marked Id and depicted in red) and a primer binding sequence (marked p and depicted in blue). The double-stranded DNA has a preferred recognition sequence for hTopI that enables hTopI to cleave S(hTopI) releasing three bases of DNA (shown in green) from the 3′end of S(hTopI). This enables the 5′end of S(hTopI) to hybridize, and hTopI can subsequently ligate the substrate into a closed circle. The generated circle is hybridized to a surface-attached primer matching the primer binding sequence (indicated by p). Subsequently, Phi29 DNA polymerase mix is added to support RCA and the resulting RCA products are visualized by hybridization of fluorescently labeled probes (matching the Id sequence) and the products analyzed using a fluorescence microscope. (C) REEAD based detection of hTopI activity in 1x, 2x, and 4x dilution of whole cell extract of Caco2 and HT29. One example (Raw data) randomly picked out of 30 individual microscopic images of each triplicate reaction sample is shown. Red signals represent RCA products generated from circularized S(hTopI) (i.e., generated by hTopI activity) and green signals represent RCA products generated from control circles. (D) REEAD based quantification of hTopI activity in 1x, 2x and 4x dilution of whole cell extract of Caco2 and HT29, depicted as mean ±SD in a log2 XY-plot. The data were collected from triplicate reactions and normalized to the mean hTopI activity in undiluted whole cell extract from the Caco2 cell culture.

