Figure 2.
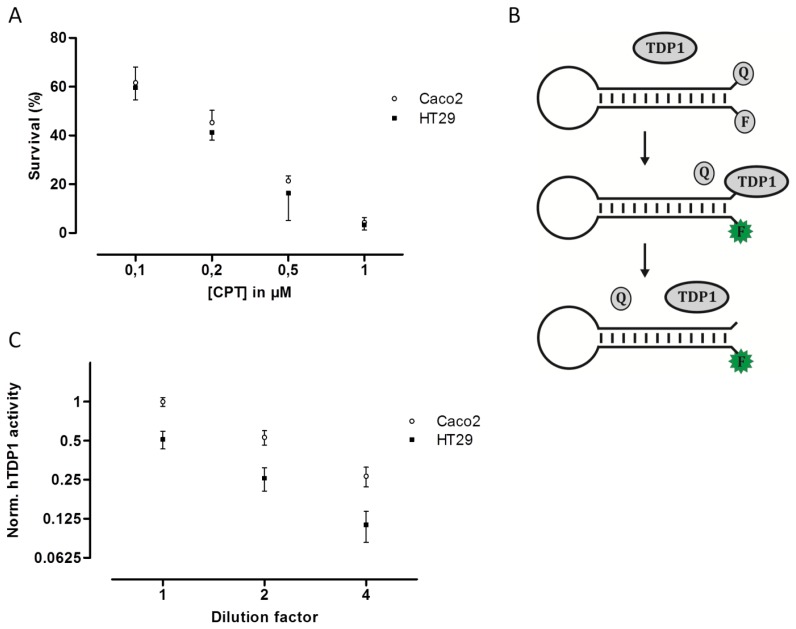
(A) Survival assay of Caco2 and HT29 cells in the presence of CPT. Caco2 and HT29 cells were incubated with 0.1, 0.2, 0.5, 1 μM of CPT for 24 hours before the percentage of viable cells was estimated using the trypan blue exclusion method. All data are presented as the percentage of live cells with mean ±SD from triplicate experiments. (B) Graphic depiction of the TDP1 assay. The TDP1-biosensor is designed to adopt a beacon structure, bringing the quencher (Q) and fluorophore (F) in proximity thus quenching the emission from the fluorophore. In presence of active TDP1, the quencher is removed from the TDP1-biosensor, and the emission of the fluorophore becomes quantifiable. (C) TDP1 activity measurement in 1x, 2x, and 4x dilution of whole cell extract of Caco2 and HT29, depicted as mean ±SD in a log2 XY-plot. The data were collected from triplicate reactions and normalized to the mean TDP1 activity in undiluted whole cell extract from the Caco2 cell culture.

