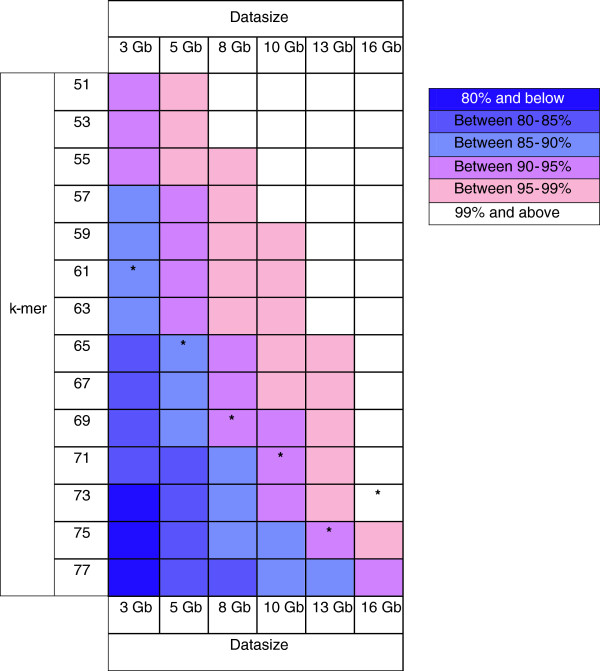
Figure 4.
Colour matrix representing the transcript mapping saturation test results. An asterisk corresponds to the assembly with the optimized k-mer and transcript N50 length for a particular datasize (1 Gb assembly transcripts were not included since the transcript N50 length was not optimized by any k-mer for this datasize). See Additional file 2: Table S2 for full details of BlastN matches by subsets of bark transcripts to the optimized 16 Gb bark transcriptome.

