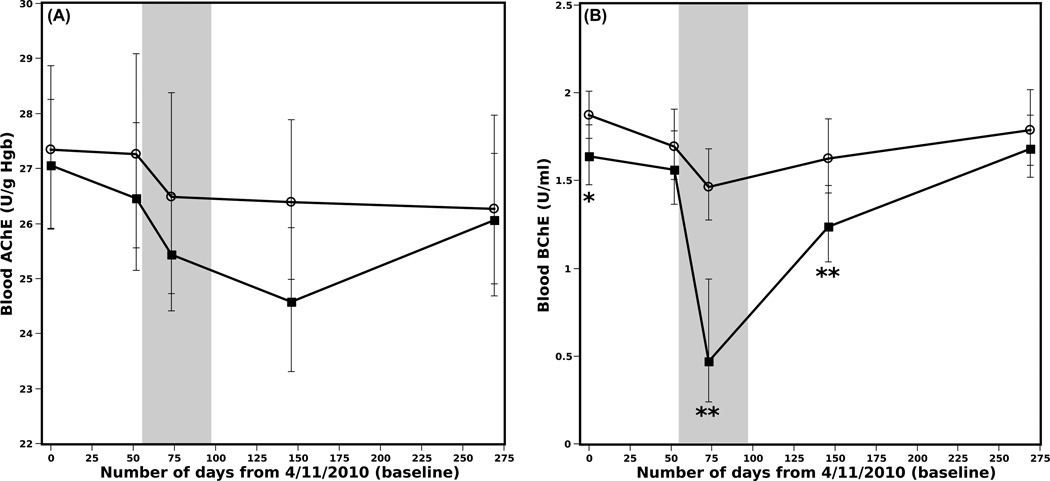
Figure 3.
Estimated median blood AChE activity (A) and BChE activity (B) for applicators (squares) and non-applicators (circles) from field stations 1 and 2 in 2010; the shaded area represents the CPF application period for field station 2. Time points showing significant differences between applicators and non-applicators are marked with asterisks (*p< 0.05; **p< 0.001). Individual confidence intervals have been adjusted for multiple comparisons so that simultaneous coverage is 95% (Bonferroni method); p-values were similarly adjusted.

