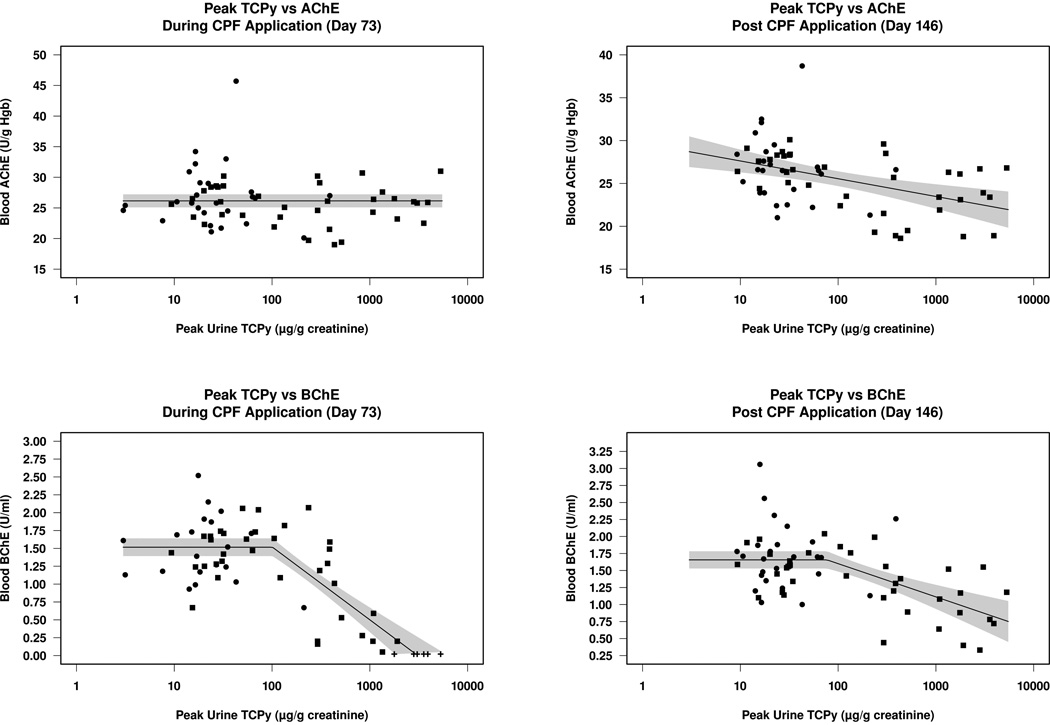
Figure 4.
Relationship between peak urinary TCPy levels and blood AChE (A&B) and BChE (C&D) for each subject during the beginning of the CPF application period on Day 73 (A&C) and after CPF application on Day 146 (B&D). Applicators are represented by squares and non-applicators by circles. Reported BChE activity of “0” (below the limit of detection) is shown by a + sign. A piecewise-linear model, constrained to be constant (horizontal) prior to the transition point, was fitted to data combined from applicators and non-applicators; the shaded region represents the 95% confidence interval for the mean response at any given peak TCPy concentration.

