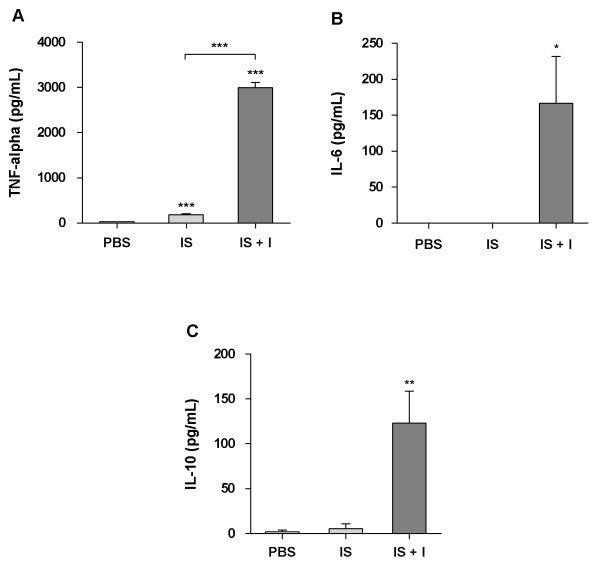
Figure 3.

Evaluation of serum cytokines – graphics. A: Comparison of TNF-α levels in the serum of control (PBS) young rabbits (n = 5), immunosuppressed (IS) young rabbits (n = 5), and immunosuppressed RHDV-infected (IS + I) young rabbits (n = 9) that died from RHD; unpaired t test, (***p < 0.0001); the results are shown as a mean ± SEM). B: Comparison of IL-6 levels in the serum of control (PBS) young rabbits (n = 5), immunosuppressed (IS) young rabbits (n = 5) and immunosuppressed RHDV-infected (IS + I) young rabbits (n = 9) that died from RHD; unpaired t test, (*p < 0.05); the results are shown as a mean ± SEM). C: Comparison of IL-10 levels in the serum of control (PBS) young rabbits (n = 5), immunosuppressed (IS) young rabbits (n = 5), and immunosuppressed RHDV-infected (IS + I) young rabbits (n = 9) that died from RHD; unpaired t test, (**p < 0.01); the results are shown as a mean ± SEM).
