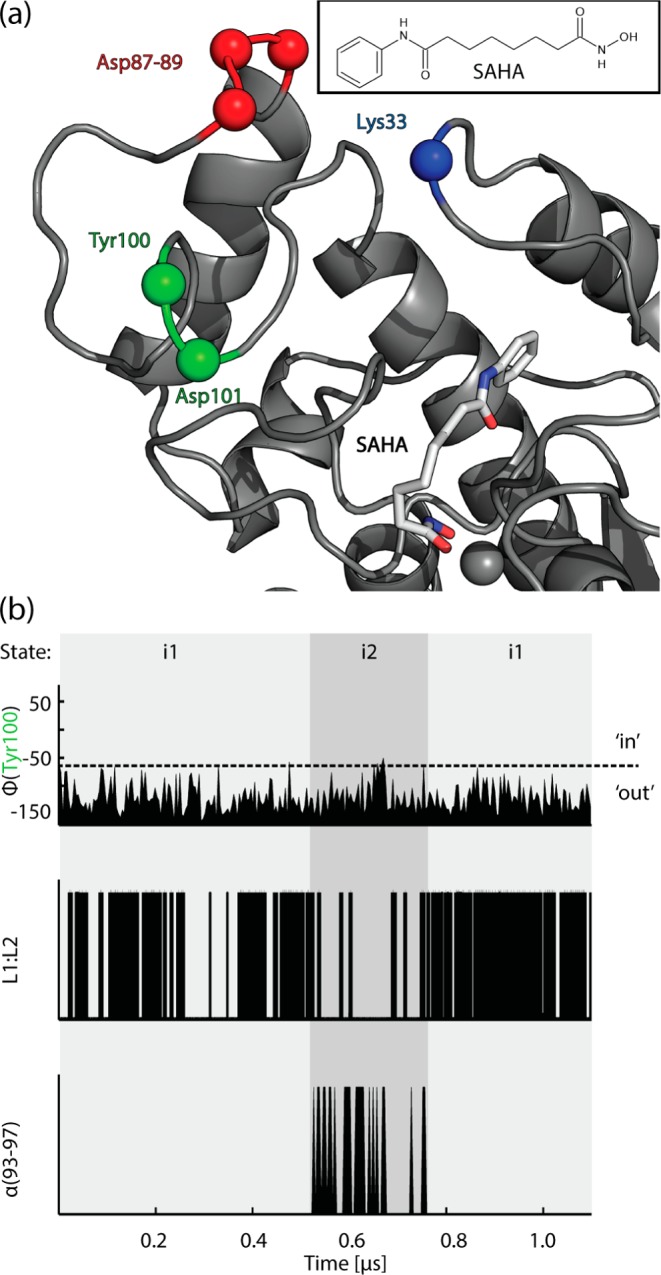
Figure 3.

States of the L1 and L2 loop conformations when interacting with SAHA (chemical structure shown in the insert). (a): HDAC8:SAHA complex snapshot of the simulation with SAHA (licorice) and HDAC8 (gray cartoon) where the binding rail is in its ‘out’ conformation. Positions of Lys33, Asp87–89, Tyr100, and Asp101 are illustrated with colored spheres. (b): Microkinetic processes over the simulation time as defined in Figure 2: (i) Φ angle of Tyr100, indicating binding-rail conformation; (ii) L1:L2 salt bridge presence between Lys33 and Asp87–89; (iii) presence of an α-helix at residues 93–97.
