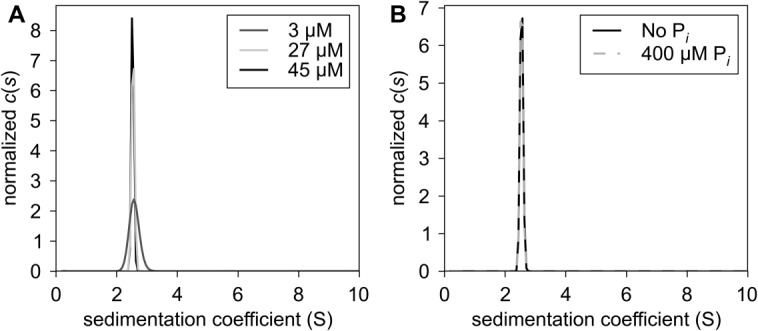
Figure 2.

Hydrodynamic behavior of rBbPstS. (A) Sedimentation in the absence of phosphate. The c(s) distributions, showing normalized signal populations of species as a function of sedimentation coefficient, are shown for three concentrations of rBbPstS, which are denoted in the legend. (B) Comparison of sedimentation in the absence and presence of phosphate. The concentrations rBbPstS in both experiments was 27 μM. The components present in the respective curves are given in the legend. All distributions have been normalized by their respective total signals.
