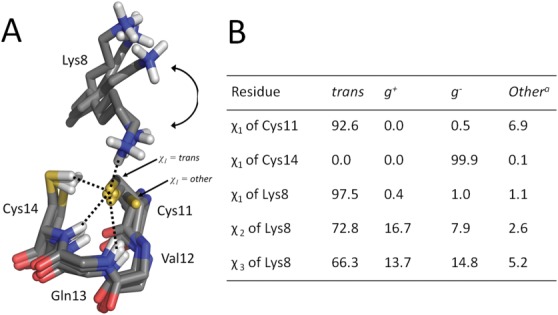
Figure 1.

The four hydrogen bonds formed with Cys11 during the MD simulation. A: Five representative snapshots were selected and the overlay of the CXXC active site is shown. In two of the snapshots Lys8 is hydrogen bonded to Cys11. In the other three snapshots Lys8 is pointing away from Cys11. During the MD simulation Lys8 adopts all conformation between the conformations shown. One snapshot shows Cys11 with a χ1 angle outside the trans conformation. For clarity, only the side chain of Lys8 and the main chain of Val12 and Gln13 are shown. Hydrogen bonds are depicted as black dotted lines. B: A table summarizing the conformations of the active-site cysteines and Lys8 during the MD simulation is shown. The side-chains torsion angle χ is given in percent of the time during the simulation. g+: gauche plus; g−: gauche minus. othera: conformations outside the conventional ranges trans, g+ or g−. See experimental procedures for the criteria used to define the torsion angles.
