Figure 2.
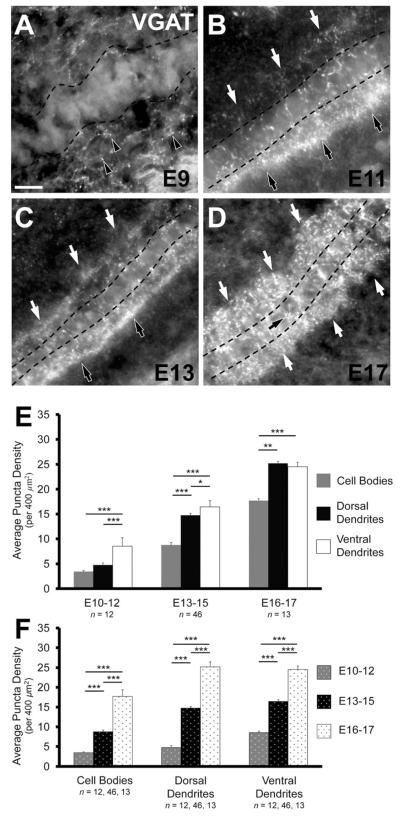
Inhibitory terminals in NL during development. A: Inhibitory inputs are first seen at E9 and are predominately located ventral (black arrowheads) to the forming NL cell layer. B: The NL neuropil and cell body layer are readily identifiable (cell layer outlined by dashed line) in E11 brainstems. Inhibitory terminals exhibit a distinctly polarized distribution in the ventral neuropil (black arrows), but are also located throughout NL cell bodies and the dorsal neuropil (white arrows). C: VGAT density increases in NL at E13–15 (represented here by E13), but the asymmetry between ventral (black arrows) and dorsal (white arrows) dendritic region remains apparent. D: A further increase in inhibitory terminals is evident at E16–17 (represented here by E17). VGAT puncta are distributed similarly in the ventral and dorsal neuropil regions (white arrows), although there remain notably fewer puncta on the cell bodies (black arrow). E: Comparison of the distribution of VGAT puncta in each of the three age groups. In the E10–12 age group there is a significantly greater density in the ventral dendritic region (8.53 ± 0.40 per 400 μm2) compared to that of the dorsal dendritic region (4.76 ± 0.51, P < 0.0002, paired t-test) and cell body region (3.44 ± 0.21, P < 0.0002). At E13–15 the ventral neuropil (16.43 ± 0.42) has a significantly greater density than both the dorsal neuropil (14.76 ± 0.40, P < 0.0002, Wilcoxon T) and cell body region (8.76 ± 0.44, P < 0.002). In this age group the dorsal dendritic region has a significantly greater density than the cell body region (P < 0.0002). At E16–17 the density of VGAT in both the ventral and dorsal neuropil are significantly greater than the density in the cell body region (17.7 ± 1.72, P < 0.02 and P < 0.002, respectively). The density in the ventral neuropil (24.51 ± 0.90) and dorsal neuropil (25.19 ± 1.27) do not differ significantly (P = 0.93). F: Change in density of VGAT puncta in each region during development. In the cell body region, both the increases from E10–12 (3.44 ± 0.21 per 400 μm2) to E13–15 (8.76 ± 0.44) and E13–15 to E16–17 (8.76 ± 0.44) are significant (P < 0.0002 and P < 0.0002, respectively). The increases in density in the ventral neuropil from E10–12 (8.53 ± 0.40) to E13–15 (16.43 ± 0.42) and E13–15 to E16–17 (24.51 ± 0.90) are significantly different (for all comparisons P < 0.0002, Wilcoxon T). Similar increases are seen in the dorsal dendritic region from E10–12 (4.76 ± 0.51) to E13–15 (14.76 ± 0.40) and E13–15 to E16–17 (25.19 ± 1.27, P < 0.0002). For E,F, *P < 0.05, **P < 0.005, ***P < 0.0005. Scale bar = 20 μm.

