
Figure 2. Detection and validation of SCAs by FISH and qPCR assays.
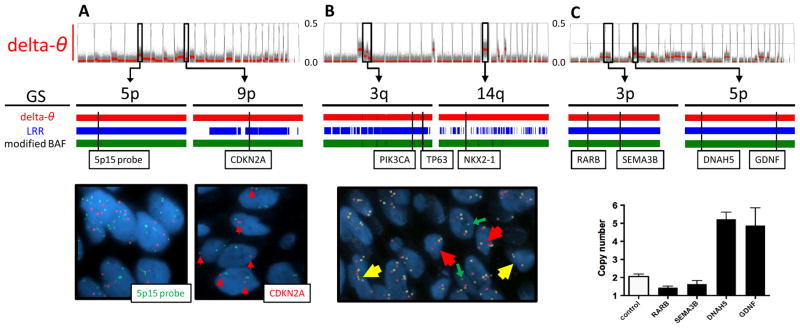
A. In a brushing sample with CIS (CIS-3 in Table 1), contaminated with normal stromal cells, several SCA regions were suggested by delta-θ (upper). Among them, the 2 regions at 5p and 9p were chosen (middle), and confirmed as amplification (copy number = 5.90 ± 2.31) and deletion (copy number = 1.36 ± 0.48), respectively, by FISH using 5p15 (green) and CDKN2A probes (red) (lower). LRR and modified BAF also detected those two regions.
B. In a biopsy sample with CIS (CIS-1), which is relatively homogeneous, several SCA regions were detected by delta-θ (upper). Using tri-color FISH probes (PIK3CA in red, TP63 in yellow at 3q, and NKX2-1 in green at 14q), 3q and 14q were confirmed as amplification (3.52 ± 1.07 and 4.30 ± 1.05) and deletion (0.48 ± 0.58), respectively. Modified BAF detected both regions, whereas fragmented segments by LRR missed the deletion at 14q.
C. In a brushing sample with moderate dysplasia (MD-3), which is relatively homogeneous, several SCA regions were suggested by delta-θ. qPCR assays predicted copy numbers at 4 locus (1.44 ± 0.08, 1.63 ± 0.20, 5.28 ± 0.40, and 4.92 ± 0.98, shown as mean ± SD in quadruplicate measurements). Control indicates reference blood (predicted copy number is 2.03 ± 0.14).
GS: genomic segmentation