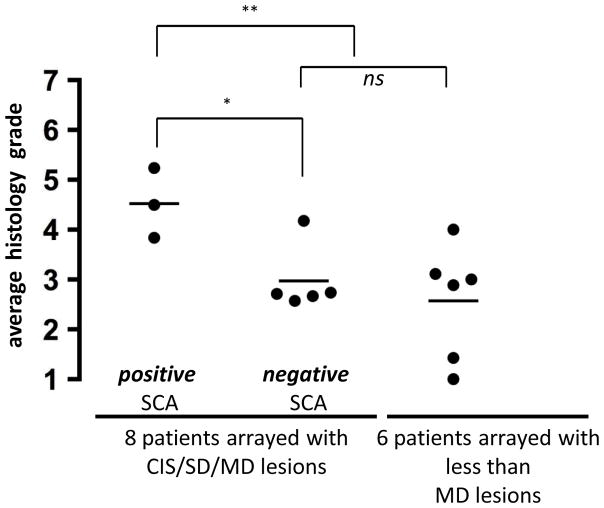
Figure 4. The correlation between individual patient’s overall average histology grade and SCA detection.
Average histology grade (from all biopsies for each patient) were compared among 3 different groups: 3 patients whose arrayed samples with CIS/SD/MD (histology grade 5–7) showed positive SCAs (left), 5 patients whose arrayed samples with SD/MD (histology grade 5–6) resulted in negative SCA detection (middle), and 6 patients whose samples with less than MD (histology grade < 5) were arrayed, but resulted in negative SCA detection (right). Each dot represents the average histology grade of a patient (see Supplementary Figure S3), and each horizontal bar shows the average value of each group’s average histology (4.5, 3.0, and 2.6, respectively). *p = 0.021 in t-test between left and middle groups; **p = 0.010 in t-test between left and middle + right groups; ns = not significant

