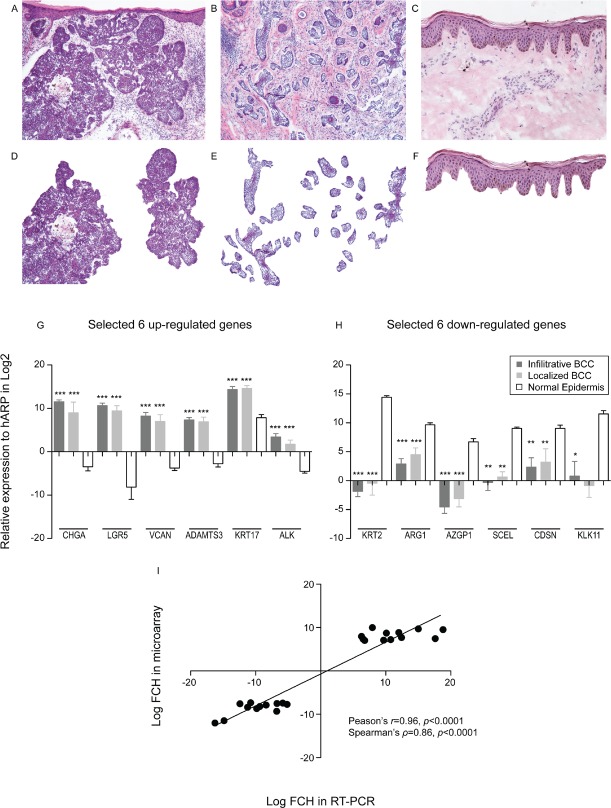
Figure 1. Laser capture microdissection identifies genes specific to BCC tumour nests.
(A-F) Representative images of tissues used in this study are shown. Upper panels demonstrate the images for (A) nodular BCC, (B) infiltrative BCC, and (C) normal skin before LCM. Lower panels represent the images for (D) nodular BCC (n=6), (E) infiltrative BCC (n=5), and (F) normal skin (n=10) after LCM. (G) The expression of selected up-regulated genes from the gene lists was confirmed by quantitative RT-PCR (qRT-PCR). *** indicates p<0.0001 vs. normal epidermis (one-way ANOVA). (H) The expression of selected down-regulated genes from the gene lists was confirmed by quantitative RT-PCR (qRT-PCR). * indicates p<0.05, ** indicates p<0.01, and *** indicates p<0.0001 vs. normal epidermis (one-way ANOVA). (I) Pearson's correlation coefficient (r) and Spearman's rank correlation (ρ) were obtained for mean log FCH from qRT-PCR data (x-axis) and that from microarray data (y-axis) using twelve genes.

